Foreword
XIII Annual conference of The European Sport Economics Association (ESEA) will be held in Haaga-Helia University of Applied Sciences Pasila campus during the last week in August 2022. This Book of Abstracts includes all accepted papers submitted for the conference. All articles have been blindly evaluated. The conference has been postponed twice from August 2020 due to the COVID-19 pandemia crises.
The conference includes a nice package of various themes in sport economics including professional sport leagues, willingness to pay, coaching, European football, and judge biases, among others. The themes capture areas in sport economics that scholars consider important. Surprisingly, the effects of COVID-19 are not widely discussed. Perhaps we must wait until we are able to say something on that topic.
The local organising committee is mainly based on persons working in Haaga-Helia’s Malmi campus, thank you Heidi, Tarja and Sari! Moreover, the ESEA Board has gone systematically through the conference design and provided detail comments on obscurities in the plan. Thank you!
As regards my own role, the overall structure of the conference and the book of abstracts is designed by myself. However, without the help and guidance of local organising committee and ESEA Board the conference would have not taken place.
On behalf of the local organising committee
August 2022
Seppo Suominen, senior lecturer, PhD (Econ)
Preface by the ESEA President
Dear Attendees of the 2022 ESEA Conference,
It is my pleasure to welcome everyone in Helsinki for the 13th ESEA Conference on Sport Economics. After two years without an ESEA Conference in presence, it is great to see colleagues again and talk about sports economics research on Haaga-Helia’s very nice Pasila campus. I appreciate that the group of attendees is slightly smaller this year because many colleagues and universities still have (to deal with) travel restrictions. Nevertheless, I am confident we will enjoy an interesting conference where we can discuss a variety of sports economics topics in presence.
I would like to extend a sincere Thank You to the Local Organizer, Seppo Suominen, PhD, who has done a wonderful job in organizing this conference and making our stay in Helsinki a pleasant one. The ESEA Board also appreciates his flexibility and patience after the cancellation of the 2020 Helsinki Conference because of the Covid-19 pandemic and the shift in preferences towards a virtual-only conference in 2021.
I would also like to take this opportunity to encourage all conference delegates to submit their conference papers to the Conference Special Issue of the International Journal of Sport Finance (IJSF), ESEA’s official journal. The call for papers will be distributed after the conference. Moreover, I encourage the ESEA Community to support our journal by submitting quality papers and providing reviews.
Yours sincerely,
Prof. Dr. Pamela Wicker
ESEA President

Skill Adoption, Learning, and Diffusion: Evidence from Soviet-style Hockey
- Francesco Amodio
- Sam Hoey
- Jeremy Schneider
Introduction
This paper assesses the impact of an unexpected, industry-wide influx of workers with a new set of skills on incumbent workers. We show that the working style brought about by new workers diffuses within and across organizations. We study the case of the National Hockey League (NHL). From its establishment in 1917 until the late 1980s, the NHL player base consisted mostly of North American players. Soviet players in particular were generally not allowed by their government to compete in North America. With the fall of the Berlin wall and the following dismantlement of the Soviet Union, Russian hockey players were increasingly able to move freely across countries and play in the NHL, which caused an influx of new players in the league. It was clear from international games in the 1980s that Soviet players had a more skilled and less aggressive style of playing hockey in comparison to North Americans (Szymanski & Wieneck, 2020). The purpose of our analysis is to establish the degree to which the Soviet style of play was adopted and diffused among North American teams and players.
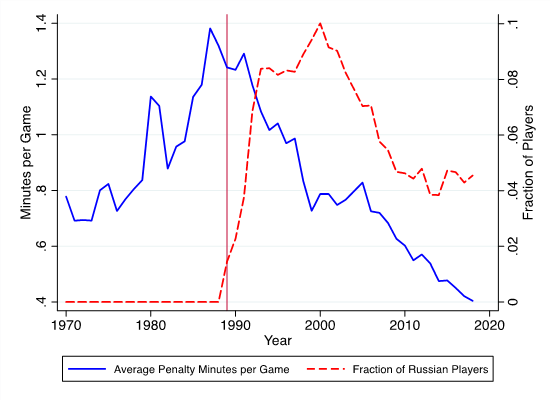
Figure 1 provides the empirical motivation for this study. The Figure shows that the aggression effort of NHL players, measured by the average number of penalty minutes per player across games, was on the rise from 1970 until the late 1980s. Starting in 1989, the share of Russian players in the NHL increases from 0 to about 10% at its peak in 2000. At the same time, aggressive behavior on ice decreases dramatically, more than can be accounted for by only the Russian players themselves. This suggests that North American players changed their style of play following the arrival of more skilled and less aggressive Russian players.
Using 50 years of data at the player- game level, we show that (i) the number of penalty minutes per game increases steadily from 1970 to 1989, while decreasing thereafter; (ii) these trends are driven by North American born players while Russian players have systematically fewer penalty minutes per game upon arrival and throughout the post-1989 period; (iii) the number of penalty minutes per game of North American born players decreases systematically with the number of Russian players on their team and on the opposing team. Evidence shows that the hockey style brought about by new players diffuses both within and across teams.
Empirical Strategy
The final aim of our analysis is to identify the extent to which the Soviet playing style diffuses both within and across teams by testing whether North American players’ behavior changes as they play not only along but also against more Russian players. We leverage information at the player-game level, restrict the sample to include only North American players, and implement the following regression specification
Y_ikgt=α+β ST_ikgt+γ SO_ihgt+〖 Z〗_it^’ θ+λ_i+ϕ_t+ε_itgs
where Y_ikgt is the number of penalty minutes given to player i on team k during game g in season t. The main independent variables are ST_ikgt, which counts the number of Russian teammates of player i during game g, and SO_ihgt, which counts the number of Russian opponents faced by player i during game g. The coefficients of interest are β and γ, which capture whether, conditional on an abundant set of time-varying controls (〖 Z〗_it^’), the performance of North American players changes systematically as they play along more Russian teammates or play against more Russian opponents respectively. Season fixed effects (ϕ_t) account for and net out average differences across seasons. We also include the full set of player fixed effects (λ_i), thus identifying the coefficients of the variation in the number of Russian teammates and opponents within players over time.
Main Result
Table 1: Penalty Minutes, Russian Teammates and Opponents
Table 1 reports the coefficient estimates from equation 1. In column 1, we begin by regressing the number of penalty minutes per game over both the number of Russian teammates and Russian opponents. The corresponding coefficient estimates are negative, but not statistically significant. In column 2, we add season fixed effects (ϕ_t) and player fixed effects (λ_i), thus exploiting variation within-season and within-player variation. North American players obtain systematically fewer penalty minutes when playing along and against more Russian players, the corresponding coefficient estimates being significant at the 1% level. These are essentially unchanged when adding a vector of time-varying player characteristic controls in column 3.
Seeing the Whole: Investigating Fans’ Holistic Thinking Tendencies as Driver for Multiple Fan Identity and Decreased Loyalty
- Anton Behrens, University of Leipzig, anton.behrens@uni-leipzig.de
Introduction
While the high demand for team sport related offers among fans used to be taken for granted due to irrational consumption patterns by loyal fans, e.g. in times of poor sporting performance (Koenigstorfer & Uhrich, 2009), recent studies find evidence for a more demanding mindset of team sport fans (Tamir, 2020). For example, some fans tend to follow specific star players (Wu, Tsai, & Hung, 2012) and shift their alliances when the quality of one team sport offer is decreasing. One avenue of research in the field of sport economics and sport management that emerged in the last years focusses on the phenomenon of team sport fans, that are following more than one team (Sun, Chien & Weeks, 2021; Watkins & Cox, 2020). Apparently, team sport demand is not necessarily centered around only one club or franchise and can be manifold. However, until today no empirical study has investigated team sport fans’ psychological differences in thinking tendencies and its effect on multiple fan identity and fans’ behavioral loyalty towards their favorite sport club in order to understand team sport demand patterns.
Theoretical background
In 2007 Choi, Koo, and Choi developed the analytical versus holistic thinking scale. Since then, the construct has been frequently used in marketing research, for example to explain different attitudes towards brand extensions (Monga & Roedder John, 2010) or to shed light on cultural differences in consumption behavior between Asian and Western consumers (Luo, Zhu, Han, 2022). The overall assumption being, that holistic thinking enables consumers to take a broader perspective on brands, markets and consumption environments and therefore helps them to be more open to new experiences, products or brand attributes. In addition, consumers may even switch between multiple identities in different consumption settings (Foreman & Whetten, 2002). Consequently, it is likely that consumers who see the team sport market from a holistic perspective are more likely to follow the sport or league as a whole, rather than fully commit to one club in particular. In other words, holistic thinking should allow them to follow more than one club from a particular sport (Ng, Chen, Ng, & Ng, 2021). Formally:
H1: Holistic thinking increases multiple fan identity.
While the followership of different team sport clubs not necessarily negatively affects the consumption of one of them, it is however likely that interferences occur. While some sports fans may support different teams in different sports from one particular city to express their local pride, other fans’ interest could be centered around one sport only. In this instance fans could either support a professional club and a lower-tier club, or might support one domestic football club and another foreign one, or they might even sympathize with more than one club from the same league, e.g. because they moved from one city to another and hold sympathies for both of them (Collins, Heere, Shapiro, Ridinger, & Wear, 2016). The current study’s focus lays on team sport fans that support more than one club from one particular sport – football. Consequently, there should be some sort of direct competition between consumption intensity and commitment between the different football clubs. This should lead to decreases in behavioral loyalty of the favorite football club if other clubs are being followed, too.
H2: Multiple fan identity decreases behavioral loyalty of football fans towards their favorite club.
Building on H1 and H2, there should also be an indirect and negative relationship between holistic thinking and behavioral loyalty through multiple fan identity.
H3: Multiple fan identity mediates the negative effect of holistic thinking on behavioral loyalty of football fans towards their favorite club.
Figure 1. Proposed research model.
Methodology
German football fans serve as research objects. Confirmatory factor analysis (CFA) and structural equation modelling (SEM) will be used to test the suggested research model.
Expected results
In the current stage of the project the data collection is ongoing. Therefore, the results will be presented at the conference. However, building on our hypotheses we expect the following theoretical and practical contributions.
Theoretical implications
While current studies on ambi-fans or polygamous fandom focus on factual reasons for the decisions to follow more than one club or explain their consumption behavior, this study is the first to shed light on psychological indicators that might affect the likeliness for team sport consumers to follow more than one club and consequently be less committed to one club in particular. Focusing on psychological factors rather than consumption circumstances shifts the focus of scholars in the field and enables us to observe general patterns of consumption in teams sports demand.
Practical implications
Practitioners gain a deeper understanding of team sport consumers and could, for example, segment the consumers based on their thinking styles (e.g. in general team sport consumers that tend to think more holistically and more attached, loyal fans of single clubs). This could help to address the needs of holistic thinkers and analytical thinkers and try to increase their demand in accordance to their overarching mindset.
Cash or Culture: Following the Vein of Olympic Gold
- Michael Barta, Monash University
- Ross Booth, Monash University, Ross.Booth@monash.edu
- Robert Brooks, Monash University
Extended Abstract
This paper examines variations in Medal Tallies at the Summer Olympic Games between top medal earning countries. Using summary statistics and fixed-effects regression analysis, results suggest that country specific Discipline fixed-effects are the main determinants of medal outcomes. It was found that medal event participation had more explanatory power in determining medal outcomes at a given Games than team size. Furthermore, medal event participation could be a measurable source of the host country effect. It is concluded that the structure of a country’s national Olympic body can have significant effects on medal outcomes.
Introduction
Since the establishment of the Australian Sport Commission (ASC) in 1985 under the Australian Sports Commission Act 1989, the agency is now comprised of two separate divisions. Each division is responsible for achieving different key outcomes. Sport Australia (SportAus) is responsible for driving greater population engagement and capability in Australian Sport, and the Australian Institute of Sport (AIS) is ‘responsible for building sustainable winning systems for Australian athletes that are measured through consistently producing podium success over multiple cycles, inspiring the next generation’ (Australian Sports Commission 2021).
As outlined by the 2021-25 ASC Corporate Plan, the vison of the AIS is ‘generating a competitive advantage for Australian athlete success at the Olympic, Paralympic and Commonwealth Games; while supporting other sports where our primary focus is enhanced by faster learning and/or where we generate incremental revenue that would justify the effort’ (Australian Sports Commission 2021).
The success factors for the vision of the AIS are:
- Podium Success – Australians consistently winning medals at major international events
- Pride and Inspiration – Australian sporting champions are a positive influence on the community, and
- World-Leading System – Australian high-performance system, is recognized as world- leading.
With the performance criteria being:
- Number of medals and medalists at the Olympic, Paralympic and Commonwealth Games and at International Championships
- The level of positive sentiment from sporting results, athlete conduct and engagement within the community, and
- Sports’ progress against a performance monitoring framework.
As an event, the Summer Olympic Games is the pinnacle of many countries sporting aspirations, including Australia. Since the first modern games run by the International Olympic Committee (IOC) in Athina in 1896, the Summer Olympics have grown to be one of the largest cultural events of the world. For the first time in its history, the 2016 Rio de Janeiro Games had every National Olympic Committee (NOC) compete in the Games. At the 2020 Tokyo Games 11,319 athletes competed across 49 Disciplines, in a total of 339 Medal Events with 340 Gold, 338 Silver, and 402 Bronze medals awarded, a total of 1080 in all. Since the first Games, a grand total of 5,121 Gold, 5,085 Silver, and 5,493 Bronze medals have been awarded. Before the 2020 Tokyo Games, the top 10 medal ranking countries had secured 3,412 Golds, 3,086 Silver, and 3,099 Bronze, a combined total of 9,597 medals, 61% of all medals awarded. These countries are; the United States, the Russian Federation, Germany, Great Britain, the People’s Republic of China, France, Italy, Hungary, Australia, and Sweden, with Japan placing eleventh in the historic Medal Tally.
This paper explores the relationship between a country’s national funding towards the Olympics, their participation at any given Games, and their Medal Tally. Furthermore, this paper attempts to determine if there are any country specific or Olympic specific factors that might drive medal outcomes. Additionally, this paper attempts to determine the most accurate measurement of a country’s participation at any given Games. The aim of this research is to provide insight into the AIS, determine if they are meeting their success factors and provide possible guidance into how they could allocate their limited resources. Detailed analysis has been conducted on either specific country’s Olympic programs or broader country demographics that lead to Olympic success. This paper aims to address why inter-country variations in Medal Tallies occur. Given the results of previous research on Olympic success, the hypothesis is that there is a significant relationship between Australia’s Olympic participation, current funding strategy and Olympic success.
The remainder of the paper is organized as follows. Section 2 reviews current literature into what drives medal outcomes at the Olympics. Section 3 gives a brief explanation of trade theory and how it may apply to Olympic success. Section 4 describes the data used for estimations. Section 5 introduces the fixed-effects methodology employed. Section 6 provides results and figures of the estimations for medal outcomes. Section 7 is a discussion of the results implications for the AIS. Finally, Section 8 contains concluding remarks and possible research opportunities.
Conclusion
This paper investigated the AIS to determine if they are achieving Podium Success. In doing so, AIS funding data per Sport and Olympic participation was compared against medal outcomes to determine if there was a significant relationship. No significant relationship was found. The same methodology was applied to a similar national body, UKSport, of Great Britain. A significant relationship was found between funding, Olympic participation and medal outcomes. A modified methodology was applied to the historic top medal earning countries to determine if there are any patterns of success between countries. It was found that significant inter-country Discipline fixed- effects were the main cause of variation in medal outcomes between countries. Furthermore, differences in intra-country Discipline fixed-effects were observed to be the main cause of variation in medal outcomes between Disciplines for a given country.
The results confirm what a casual observer of the Olympic Games can tell you. The Japanese are extremely successful in Judo, the Australians and Americans do exceptionally well in Swimming, and the Russians and Chinese will compete for many of the Artistic Gymnastic medals.
The aim of this research was to determine if Australia had a World-Leading System when it comes to sporting success. The research shows that in some parts it does, it also shows that it is possible to do more with less. The research also shows that there needs to be greater care and consideration about where Australia should put their limited resources moving towards the 2032 Brisbane Games, otherwise the results might be the ‘arms- race’ prisoner’s dilemma game as foretold by Humphreys et. al. (2018).
Additionally, this research highlights the important role that the separate national sporting bodies have in determining athlete success in Australia. Further research opportunities exist in determining how Australia has such large and significant inter-Discipline fixed-effects and how other top medal earning countries differ in their Olympic programs.
Reluctant to Move? Salary Penalties for Domestic Players in European Football
- David Berri, Southern Utah University
- Alex Farnell, Maynooth University, alexander.farnell@mu.ie
- Robert Simmons, Lancaster University
- Esperance Yassine Bamba, Southern Utah University
Introduction
A considerable literature exists attempting to identify wage premia and wage penalties for specific groups in professional team sports. For example, the National Basketball Association has increased its hiring’s of foreign-born players over the least 30 years, though evidence of salary differentials for foreign players is mixed.
While North American sports have extensive salary and performance data, all publicly available, attempts to estimate salary premia or penalties by nationality for European football face the dual problems of lack of precise and credible salary data, and thin performance data. Early examinations of European football simply used goals and assists as performance measures, which do not cover contributions of defenders and midfielders. Some studies (Szymanski, 2000; Deschamps and De Sousa, 2021) have worked around this problem by regressing team performance on relative wage bill and numbers or proportions of black players on team rosters. These papers show evidence of discrimination against black players in the 1970s and 1980s. Deschamps and De Sousa also find that, after the 1995 Bosman Ruling which loosened mobility restrictions, pay discrimination remained for just one identifiable group: black non-EU players who faced immigration control restrictions.
Until recently, Italy’s Serie A was the sole source of credible player salary data in European football. Gazzetta dello Sport has published salaries of Serie A players each September since 2008, with authors such as Bryson et al., 2014 and Carrieri et al, 2018 making use of these. The paper closest to ours is Bryson et al., 2014. The authors identified a salary penalty for domestic (Italian) players relative to their migrant counterparts.
Contributions
We extend the work of Bryson et al. (2014) in three distinct ways. First, we have salary and performance data for a much larger sample of players over seven seasons (2013/14 to 2019/20) from five top European leagues: the English Premier League, French Ligue 1, German Bundesliga, Italy’s Serie A and Spain’s La Liga. This offers greater generality of results compared to Bryson et al. who only covered Italy. Second, Bryson et al.’s nationality classification was rather coarse being limited to Italian, non-Italian European Union and non European Union. We extend this classification to explicitly cover the continents of Europe, North and South America, Africa and Asia. Third, although Bryson et al. had a deep set of player performance controls in their model, they did not specify precisely which performance metrics were important in predicting player salary. We make a further contribution by using a richer set of performance metrics from www.whoscored.com, which are matched with our salary data. We then show the most important performance metrics for salary determination within a parsimonious model.
Data
Our assembled dataset gives us information on 3,458 outfield players in the top 5 European leagues over a 7 season period. Goalkeepers are excluded as they have qualitatively different roles and performance metrics to outfield players. This amounts to 10,455 player-season observations. Salary data were purchased by subscription from www.capology.com, where salaries are sourced from surveys of player agents (The salary values for Italy’s Serie A players exactly match the figures published by Gazzetta dello Sport).
We include as explanatory variables various proxies for human capital such as age, and number of career appearances in top 5 European leagues, other leagues and UEFA competitions. We include minutes played in previous season expecting this to be positively associated with salary. Our performance measures include pass completion percentage, average passes completed per game and shots on target per game. All performance measures are taken from previous season to allay potential endogeneity concerns. A team’s ability to pay is proxied by the log of the previous season’s average attendance. We include a dummy variable to denote whether a player switched teams between seasons, with the expectation that most players move to better teams who can pay higher salaries.
Our primary interest is the effect of nationality on player salary, thus, we initially include dummy variables for continent of origin i.e. Africa, Asia, South America, North America and Oceania. We also include a dummy variable ‘Home’, defined as 1 if a player has the same nationality as the league which he is contracted to (i.e. English, German, French, Italian, or Spanish).
Methodology
We start by estimating a standard wage equation (for player i in season t):
Log payit = β0 + β1Ageit + β2Age2it + β3Career appearancesit-1 + β4Performanceit-1 + β4Game timeit-1 + β5Team attendanceit-1 + β6Continenti + Position fixed effects + Season fixed effects + League fixed effects + error
which is estimated with OLS initially. However, log salary shows skewness and excess kurtosis, rendering OLS estimation inappropriate. As such, we run unconditional quantile regression models as applied recently by Carrieri et al. (2018). Note that inclusion of player fixed effects is inappropriate due to their collinearity with nationality. We experiment with alternative variables to capture career appearances and performance.
Preliminary Findings
Age and age squared deliver familiar positive and negative coefficients, respectively. For unconditional quantile regression at the median the turning point in age is 26.5, in line with industry expectations and previous work. Appearances in UEFA competitions, top 5 leagues and other leagues have significant, positive coefficients that reduce in size according to competition status. Perhaps surprisingly, we find no significant effect of national team appearances on player salary. Minutes played in previous season has a positive and significant effect on salary. From the performance statistics considered we find significant effects for pass completion rate, average passes completed and shots on target. This reflects the modern emphasis in football on passing and ball retention.
Season dummies reveal higher salaries from 2016/17 compared to earlier seasons, and league dummies show the ranking of salaries to be England, Italy, Spain, Germany and France, in line with expectations. The ranking of salary by position is forwards, midfielders then defenders again as expected. Players who switch teams tend to earn higher pay.
Of the Home and continent of origin dummies, Home, African and South American deliver significant coefficients. The other continents failed to deliver significant coefficients. Preliminary results for said nationality effects are shown in the table below (t statistics in parentheses).
We observe significant and substantial salary penalties for African players at median and below. South American players earn salary premia from 25th quantile upwards. Interestingly, home players receive salary penalties at median and below yet salary premia emerge at 75th and 90th quantiles. Players in these quantiles tend top be established stars, superstars even at 90th quantile (Bryson et al., 2014). Moreover, leagues and UEFA have introduced quota rules to guarantee a number of roster slots to ‘domestically trained’ or home grown players. This perhaps leads to an outcome where star domestic players earn a salary premium while more substitutable players receive a salary penalty.
Of great interest here is whether home grown players generate enhanced salaries via popularity as well as their performances. This, along with a finer classification of nationality origin e.g. Wester European countries versus Eastern European, as well as the mobility channels for arrival into a given league, will be pursued in further work.
Demand for TV Broadcasts of UEFA Champions League Games in Danish Television – The Impact of Uncertainty of Outcome, Team Reputation, and Superstars
- Oliver Budzinski, Ilmenau University of Technology, Germany
- Arne Feddersen, University of Southern Denmark, Denmark
- Philipp Kunz-Kaltenhäuser, Ilmenau University of Technology, Germany, philipp.kunz-kaltenhaeuser@tu-ilmenau.de
Relevance and Motivation
The year 2021 witnessed the outbreak of a fight about the right way of organizing the highest level of European football: while the Union of European Football Associations (UEFA) presented their model of a reformed UEFA Champions League (UCL) (UEFA, 2021), a company called A22 (representing a number of high-profile European football clubs) presented an alternative model of a so-called European Super League (ESL) (Wagner et al., 2021). However, there are noticeable conceptual differences between the models proposed by UEFA and A22 and much of the argumentations from both sides focuses on fans preferences. At the core, this addresses the question of drivers of the demand for stadium attendance and TV broadcasts. While both represent a recurrent topic in sport economics, especially the latter drives the commercial business of football: broadcasting revenues represent the single biggest revenue source (Boyle, 2015).
One of the conceptual controversies in the context of premium level football in Europe is concerned with the question whether fans have a stronger preference for (more) games between the top teams (as the ESL proponents argue; Hamilton, 2021) over a broad participation of less well-known clubs representing more of the regions in Europe or vice versa (Solberg & Gratton, 2004). Sports economic theory offers explanations for both views: Superstar effects (Hausman & Leonard, 1997; Lucifora & Simmons, 2003; Berri et al., 2004; Jewell, 2017), local hero and home-win preferences (Brandes et al., 2008), as well as uncertainty of outcome (Rottenberg, 1956; Neale, 1964) considerations affect consumer demand, yet the direction of their effects is ambiguous.
Since theory does not point into an unambiguous direction, empirical analysis of the demand for broadcasts of premier level European team football games is warranted. Due to the trade-off between (i) superstar clubs coming from very few national leagues (England, Spain, Germany, France, Italy) and most superstar players, irrespective of their nationality, playing for these star clubs and (ii) local top clubs from other countries and regions rarely making it into the final rounds of top level tournaments, it is particularly interesting to analyze audience behavior in a country outside the top 5 leagues because here the local top club is likely to not or only rarely qualify for a top-tier pan-European competition. While fans in top-5-league countries will witness some domestic clubs compete in each of the proposed models, Danish fans – as an example for a non-top-5-league country – are more likely to “lose” their domestic clubs in the ESL scenario. Therefore, it is particularly interesting to know how Danish broadcast demand changes if superstar clubs play against each other, local heroes are present, and uncertainty of outcome changes. This can give indication whether fans care more about top games or more about local heroes.
Related Literature
The literature regarding the determinants of demand for sports has been dominated by studies of game attendance at sporting events (for comprehensive reviews, see Borland & Macdonald, 2003; Szymanski, 2003; García & Rodríguez, 2009; Schreyer & Ansari, 2021). For a long time, studies of the demand for TV broadcasts have been underrepresented in the literature (strongly due to limited data availability). Although many determinants are theoretically and empirically identical, it can be assumed that some determinants of TV demand differ distinctly from stadium attendance. One key example would be differences in consumers’ preferences for outcome uncertainty and wins of the home team (Forrest, Simmons, & Buraimo, 2005; Coates, Humphreys & Zhou, 2014). So far, the empirical evidence on the demand determinants of TV audiences is still limited, although growing during the last couple of years. Early studies on television demand for live sports include Kuypers (1997) and Forrest, Simmons, and Buraimo (2005). These studies were followed, inter alia, by Johnsen and Solvoll (2007), Weinbach and Paul (2008), Paul, Wachsman, and Weinbach (2011), Alavy et al. (2007), Nüesch and Franck (2010), Di Domizio (2010), and Feddersen and Rott (2011). Most of the existing research focusses on either North-American Major Leagues (Weinbach and Paul (2008); Tainsky, 2010) or top tier domestic leagues in European football (Forrest et al., 2005; Buraimo & Simmons, 2009, 2015; Perez et al., 2017). This paper contributes to the literature by providing a novel setup for the analysis of the demand for TV broadcasts in a European country which does not have a strong domestic league or strong clubs on the European level. The fact that the Danish champion does not qualify for the UCL group stage in many seasons (but in some) allows us to analyze the impact of superstar teams (e.g., Real Madrid, Manchester United, Juventus, Bayern Munich, PSG) as well as the local hero clubs (i.e., Danish clubs). Furthermore, the absence of a strong local hero club offers an interesting setup to analyze the effect of outcome uncertainty.
Methodology
We analyze television ratings of live broadcasts of UCL games in Denmark. The data is collected by Kantar Media, which uses a representative panel of 1,200 Danish households to estimate the nationwide television ratings. Our analysis is based on the average number of TV viewers of UCL matches with an age of 3 years or older from 2006/07 to 2018/2019.
We estimate a semi-logarithmic OLS regression model where the dependent variable is the natural logarithm of the average TV audience of UCL matches broadcasted in Denmark. To capture time-invariant heterogeneity in the participating teams and effects across seasons, fixed-effects are included. We use win probabilities based on betting odds as a proxy for the uncertainty of outcome as it is frequently used in the literature. The model includes variables on the participating clubs such as their overall market value, the number of superstars on their roster, their UEFA 5-year-coefficients, and whether they are a Danish club or not. Furthermore, we control for weather (precipitation and temperature) as well as the progression of the tournament (round of sixteen, quarterfinal, semi-final, final).
Results and Conclusions
We find that the presence of superstar clubs as measured by accumulated market value of players increases broadcast audience significantly. Team quality as measured by UEFA 5-year-coefficients as well as the presence of high-earning superstar players lack a significant effect. Matches including Danish clubs increase TV audiences , whereas the number of Danish players on a team’s roster (local hero players) do not. Uncertainty of outcome increases TV demand in our model, supporting the UOH for TV audiences and furthering the discussion around diverging preferences between stadium attendance and TV demand. The estimated coefficients for the probability of a home win and its squared value are statistically significant and indicate an inverse U-shape relationship, Which is in line with the OUH.
Our findings support the hypothesis that fans prefer seeing games between superstar clubs, while they also provide evidence for a preference of the presence of local clubs in the competition. Interestingly, the status of the club matters more than the status of the players. Therefore, based on our preliminary results, the conclusion might be drawn that a competition design with many games between foreign non-superstar clubs is uninteresting for fans; however, the absence of local clubs seems to have a negative effect on TV ratings.
Should Organizing Premier-Level European Football Be a Monopoly? And Who Should Run It? – An Economists’ Perspective
- Oliver Budzinski, Ilmenau University of Technology, Germany, oliver.budzinski@tu-ilmenau.de
- Arne Feddersen, University of Southern Denmark, Denmark
Introduction
In April 2022, twelve clubs agreed to form a mid-week pan-European football club competition, the Super League, which would be in direct competition to the Champions League (UCL) organized by the Union of European Football Associations (UEFA). Besides a strong public backlash from football fans, UEFA, the Fédération Internationale de Football Association (FIFA), the English, Spanish, and Italian football associations as well as the respective league organizations have immediately opposed and publicly condemned the project. In a subsequent press release, the above-mentioned governing bodies of football announced that the twelve involved clubs will be banned from playing in any competition at domestic, European or world level organized by those governing bodies. Furthermore, the players from the twelve ESL clubs were threatened that they could be denied the opportunity to represent their national teams.
In late April 2021, the clubs and company (A22 Sports Management) behind the Super League received legal protection from a Spanish commercial court. In mid-May 2021, the concerned court referred a preliminary question to the Court of Justice of the European Union (CJEU). Here, the question to be clarified is whether FIFA and UEFA have violated articles 101 and 102 of the TFEU and especially if UEFA’s monopoly position as (1) the solely governing body, (2) the disciplinary institution, and (3) income distributor is illegal according to European Union competition law. Furthermore, the court also investigates a potential abuse of a dominant position by UEFA through (a) actions to press the involved clubs to abandon the project, (b) the issuing sanctions, and (c) threatening to exclude the involved clubs from all UEFA competitions.
The aim of this analysis is to provide insights into the question whether UEFA (or other premier-level governing bodies in sports) can take on the three roles as sole regulator, operator, and gatekeeper at the same time without infringing European competition law.
Structure
In economics, monopolies are associated with severe consumer (fan) welfare loss and massive dynamic inefficiencies. Therefore, effective competition in every market is the generally preferred organization of commercial activities and, subsequently, the main goal of competition law and policy. Yet, there may be situations where a single supplier of a good may exceptionally be superior to competition. Organizing premier-level sports is often viewed to be such an exception – as in the EU with the pyramid structure of sports associations governing professional (and commercial) sports (as described, inter alia, in the EU White Book on Sports).
In the first part of this chapter, we review this assertion from a modern economics perspective. What are the economic arguments in favor of the pyramid structure, what are those against it – and how should they be balanced? What do the manifold empirical studies tell us about the relevance of the pros and cons? In doing so, we unbundle the monopoly governance by identifying specific tasks that require a single supplier/organizer and those that can be subject to market competition.
In the second part of the paper, we go beyond these theory-driven categorization by looking into the checks and balances that are necessary for a workable, efficient, and fair use of the inevitable monopoly power. This includes identifying areas which need to be separate and independent from each other to avoid and balance conflicts of interests. Furthermore, we discuss for the identified monopoly areas who should run them in order to maximize social and consumer (fan) welfare.
Theory and Methods
This paper is a classical competition policy paper, i.e., it applies modern state-of-the-art insights from industrial/sport economic theory and empirical evidence from the literature to assess, evaluate, discuss, and propose competition rules and their application/enforcement. The approach in this paper can be classified as institutional economics as well as law & economics. The analysis is based on the extensive literature on competition policy in sports markets but is also looking at insights from similar cases from other markets (e.g., media markets, online retail platforms).
Results and their Relevance for Sports Competition Policy
Our analysis yields relevant implications for the application of competition law to premier-level sports leagues. In the light of our results, suggestions are derived to (i) revise the three-step-procedure in European competition policy towards sports markets (as laid out by the European Commission) as well as (ii) the case judgments defining the borders of sports associations’ monopoly power (like the FIA case, the Premier League case, the UEFA case, and the Bundesliga case – as well as comparable cases on national level, esp. Germany, Great-Britain and France). Our results are relevant for the pending competition law case in European football “Super League vs. UEFA”. However, besides this concrete case, our analysis is providing insights for competition policy in sports markets and its enforcement and it will be helpful for the future design of the governance of premier-level sports leagues and, thus, for league organizers and managers.
Gender differences in choking under pressure: Evidence from alpine skiing
- Christoph Bühren, Ruhr-Universität Bochum, Germany, christoph.buehren@ruhr-uni-bochum.de
- Martin Gschwend, University of St. Gallen, Switzerland
- Alex Krumer, Molde University College, Norway
Motivation and purpose of the paper
The purpose of our paper is to investigate whether having a compatriot course setter influences performance of professional alpine skiing racers and to examine whether there are any gender differences in this response. The desire to win likely depends on the perceived importance of the competition and the belief about one’s likelihood to win it. We analyze gender differences in performance under pressure in an unusual clean setting, in which the importance of the competition and the expectation about one’s performance are exogenously manipulated. We compare the performance in the first runs of Slalom and Giant Slalom to the more important second runs in these competitions. Moreover, we distinguish between runs that are set by the own team captain and runs set by the captain of another team. It should be an advantage to compete on a course set by the own team captain, which is likely to induce high expectations. Finally, we compare the results in the most technical and, thus, skill-based discipline (Slalom) to the most effort-based discipline in our sample (Super Giant Slalom) and to a discipline in between those two (Giant Slalom).
Theoretical background
Cohen-Zada et al. (2017) find that choking under pressure, i.e. performance decrements despite high incentives to perform well, is more prevalent among men than women. The authors argue that for men it seems to be too important to win (see also Niederle and Vesterlundt, 2007).
Böheim et al. (2016) replicate the result of Grund et al. (2012) that male basketball teams increase their risk-taking at the end of the game. In contrast, the authors observe that female teams (from the Women’s National Basketball Association) reduce their risk-taking at the end of the game. When trailing, Böheim et al. (2016) find some evidence that male teams reduce their chances to win with this strategy, while female teams increase their chances.
Bozhinov and Grote (2008) find that male, as well as female, volleyball players reduce their serve errors in crunch time compared to the rest of the game. However, both genders also serve fewer aces in crunch time. Moreover, men serve less jump serves and more average serves – as opposed to good serves that restrict the attack possibilities of the opposing team. As a result, male and female players lose more points on serve in crunch time compared to the rest of the game – they choke under pressure. The effect size of crunch time on losing more points on serve is slightly larger in the men’s than in the women’s sample.
Further evidence that the level of risk-taking in pressure-situation can be suboptimal comes from Paserman (2010). The author finds that tennis players inefficiently reduce their risk-taking at very important points. By just looking at unforced errors in tennis, Paserman (2007) concludes that women choke more under pressure than men. The estimates of the game-theoretic model in Paserman (2010), however, suggest that especially men’s performance decreases under pressure because they play these points too safely. This interpretation seems to contradict the findings of Charness and Gneezy (2012) but is in line with Cohen-Zada et al. (2017).
Empirical description
We collected data from the official website of the FIS on all men’s and women’s Slalom, Giant Slalom, and Super Giant competitions that took place in the World Cups, World Championships, and Olympic Games for the seasons from 2001/02 to 2017/18. The final dataset consists of 442 men’s and 445 women’s competitions. The data include performances of 1,196 men and 956 female racers. In men’s competitions, there were course setters from 17 countries; in women’s competitions from 16 countries. Overall, our data consist of 40,150 races among men and 36,968 races among women.
We use a racer per season fixed effects model that allows us to compare the performance of racers when they compete on the course that was set by their compatriot to the performance of the same racers when they compete on the course that was not set by their compatriot. Our main variable of interest is a dummy variable that receives the value of one if a course setter is a compatriot of a racer in the respective run. To estimate the possible effect of having a compatriot course setter on performance in alpine skiing, we have a set of four outcome variables. The first two are dummy variables that receive the value of one if a racer did not finish the first run or the second run. The third outcome variable is a dummy variable that receives the value of one if a racer finished the competition in one of the top three positions. Our last outcome variable is the number of World Cup points that a racer achieved in the respective competition.
Main results
In the men’s competitions, we see that having a compatriot course setter has no significant effect on the probability of failing to complete the first run in all three disciplines. Surprisingly, we find that having a compatriot course setter increases the probability of failing to complete the second run by 4 percentage points in Slalom. This result suggests that having a compatriot course setter in the second run of Slalom competitions not only does not help, but it even impairs the performance of the racers. However, we find no significant effect in Giant Slalom. Finally, we observe no significant relationship between having a compatriot course setter and being on the podium or achieving World Cup points in the men’s competitions.
In the women’s competitions, we also find that having a compatriot course setter has no significant effect on the probability of failing to complete the first run in all three disciplines. However, we observe that having a compatriot course setter decreases the probability of failing to complete the second run of Slalom competitions by 3.8 percentage points. This result, in contrast to our finding for male racers, suggests that having a compatriot course setter in the second run of Slalom competitions enhances the performance of female racers. Even though we find no significant effect on the probability of being on the podium, having a compatriot course setter has a positive effect on the overall performance in terms of women’s World Cup points in Slalom competitions. More specifically, female racers whose compatriot sets the course in the second run of Slalom competitions are expected to gain 1.6 World Cup points more.
We explain these results by gender differences in choking under pressure in skill-based tasks. Our findings complement the results of Ariely et al. (2009), Cohen-Zada et al. (2017), and Harb-Wu and Krumer (2019). Having a compatriot course setter should be an advantage but also sets expectations to perform well, which seems to induce inefficient levels of risk-taking among men in crucial stages of a competition.
Professional Sporting Events Increase Seasonal Influenza Mortality in US Cities
- Alexander Cardazzi, West Virginia University
- Brad R. Humphreys, West Virginia University
- Jane E. Ruseski, West Virginia University, jeruseski@mail.wvu.edu
- Brian P. Soebbing, University of Alberta
- Nicholas Watanabe, University of South Carolina
Abstract
The COVID-19 pandemic shut down sporting events worldwide. Local policy makers and league officials face important decisions about restarting play, especially in pro-fessional leagues that draw large numbers of spectators. We analyze the impact of professional sporting events on local seasonal influenza mortality to develop evidence on the role played by sports in airborne virus transmission. Results from a difference-in-differences model applied to data from a sample of US cities that gained new profes-sional sports teams over the period 1962-2016 show that the presence of games in these cities increased local influenza mortality by between 4% and 24%, depending on the sport, relative to cities with no professional sports teams and relative to mortality in those cities before a new team arrived. Influenza mortality fell in cities with teams in some years when work stoppages occurred in sports leagues. Sports league reopening policies should take into account the role played by sporting events in increasing local seasonal flu mortality.
We thank participants in the ROSES seminar hosted by the University of Reading, UK, for useful comments and suggestions.
A Diagrammatic Depiction of the Rottenberg Invariance Literature
- Dennis Coates, University of Maryland, Baltimore County and HSE University , coates@umbc.edu
Motivation
The sports economics literature traces much of its active research agenda to issues raised by Simon Rottenberg in his seminal article “The Baseball Players’ Labor Market”. One issue, perhaps the single most examined issue, is the extent to which the equilibrium outcome in the sports labor market is invariant to alternative institutions in that market. In what has come to be known as the Invariance Proposition, Rottenberg states: „It seems, indeed, to be true that a market in which freedom is limited by a reserve rule such as that which now governs the baseball labor market distributes players about as a free market would (Rottenberg, 1956, p. 255).“
The Invariance Proposition implies that the sporting competition under the reserve rule distributes wins about as a free market in player labor would. Natural developments of the literature include the assessment of alternative league policies, like salary caps and revenue sharing, for what they implied for the distribution of wins among the teams in the league, and the extent to which the Invariance Proposition would hold in the win-maximizing setting of European football. The purpose of this paper is to present a fairly simple diagrammatic model that combines these insights.
Theoretical description
The model assumes a two-team league and clubs that are profit-maximizers. Profit functions exist that relate profits to winning percentage, deriving from the difference between the revenue and cost functions. These profit functions have the regular inverted U-shape implied by a revenue function that is concave in winning percentage and a cost function that is convex in winning percentage. In addition to the profit functions of the two clubs is a constraint that the winning percentages of the two clubs add to 100. Putting these functions in their own quadrant of a four quadrant diagram, one can go from every competitive outcome in winning percentage tot he profit of each club. Those profits identify a point on a curve identified as the profit possibility frontier. The profit possibility curve identifies every combination of profits for the two clubs that can be generated from a logically consistent league outcome, that is, one that satisfies the adding up constraint on winning percentages, given the revenues and costs faced by each club.
Main results
The Invariance Proposition is reflected in the profit possibility function for a simple reason: the cost function reflects all opportunity costs of production, including those associated with keeping or selling a player contract under the reserve clause. Under a free market in players, the player gets the surplus his/her performance generates, but the opportunity cost to the clubs is no different than under the reserve clause. Consequently, under either labor market regime, the profit possibility frontier is in exactly the same position. The winning percentage combinations and their associated profits are the same whether players labor under the reserve clause or free agency, so the competitive balance is invariant tot he labor market regime.
League policies like revenue sharing and salary caps change one or both of the position and the shape of the profit possibility frontier. Doing so means it is unlikely to produce the same winning percentage pairs with and without such policies.
Racial Discrimination and the Home Advantage Effect – New evidence from Tennis
- Carsten Creutzburg, University of Hamburg, steffen.mueller@uni-hamburg.de
- Wolfgang Maennig, University of Hamburg
- Steffen Q. Mueller, University of Hamburg
Introduction
It is widely acknowledged that fan support contributes to the home advantage effect in various sports (e.g., Jones 2013; Downward, Dawson and Dejonghe 2009; Koyama and Reade 2009). (Previous research typically distinguishes between four factors contributing to the home advantage effect: Crowd factors, familiarity with local conditions, travel factors and rule factors. A large share of research suggests that crowd factors are a major driving force of the home advantage effect, see, e.g., Jamieson (2010) and Anders and Rotthoff (2014).) Similarly, it typically assumed than fans prefer players to be of similar race as their own, and previous research finds that fan discrimination can impact can impact stadium attendance (e.g., Tainsky and Winfree 2010), TV ratings (e.g., Konjer, Meier and Wedeking 2017), social media consumption (e.g., Watanabe et al. 2017), collectible purchases (e.g., Nardinelli and Simon 1990), and All-Star voting (e.g., Hanssen and Andersen 2017). The literature on the home advantage effect in sports is extensive (corresponding literature surveys are provided by, e.g., Schreyer and Ansari (2021), Jamieson (2010), and Courneya (1992)); however, while existing studies typically incorporate previous potential differences in the home advantage effect across locations, existing research does not account for player race and ethnicity (e.g., Koyama and Reade 2009; Koning 2011; Filipcic et al. 2013; Ovaska and Sumell 2014; Chun and Park 2021). In contrast, this is the first study to assess the extent to which the home advantage effect depends on players’ racial and ethnic affiliations.
In this study, we investigate the potential impact of fan discrimination on the home advantage effect by predicting individual game outcomes using men’s professional tennis data from 2001 to 2017. (The original data set covers 46,930 individual matches played over the course of the 2001 to 2017 season. We discard 1,771 matches that have not been finished regularly due to retirement, disqualification, or walkover. In addition, we drop 914 matches with missing odds-data, resulting in a final sample size of 44,930 individual games. The data include games from the tournaments: Grand Slams (18%), ATP Finals (1%), ATP Tour Masters 1000 (21%), ATP Tour 500 (14%), and ATP Tour 250 (46%). The largest share of games is played on hard court (54%) and the predominant condition is outdoor (82%). In 33,169 (74%) of the matches, none of the two players has a potential home advantage. In 10,410 (23%) matches, one player has a potential home advantage, and there are 1,351 (1%) matches with two home players. The data used in this study are collected from atptour.com (game and player data) and tennis-data.co.uk (betting odds).) To this end, we analyze two different outcome variables. In addition to using the binary game outcome (did the player with a home advantage win), as an innovation of our study, we use winning probability derived from betting odds as numeric outcome variable.
A major obstacle in the empirical analysis of discrimination in sports markets is the scarcity of available information on player race and ethnicity (Foley and Smith 2007; Hamrick and Rasp 2015; Kahn 1992). As a result, it is common practice to determine racial and ethnic profiles by manually inspecting player pictures and/or names and birthplaces (Hanssen and Andersen 2007; Tainsky, Mills and Winfree 2015). Following recent advances in discrimination research, similar to Maennig and Mueller (2021) we combine automated data acquisition and racial identification techniques to reduce data collection costs and mitigate human bias in race classification. We first use web scraping techniques to collect pictures on 1,174 individual players; then, we use a deep-learning based facial recognition API to identify groups of players with similar racial appearance. However, unlike previous research, we innovate by using a k-means clustering approach based on the API race category predictions to identify different clusters of players with similar racial and ethnic profiles (We use the “Kairos” face recognition API that gives percentage values for four race groups (Asian, black, Hispanic, white, and other.); the resulting procedure results in five racial categories: African (N=29), Asian (78), Caucasian (N=627), Indian (N=16), and Southern (N=424).
Summarizing our preliminary findings based on linear and logistic regression using game outcome and winning probability as dependent variables, this study provides evidence for the existence of a home advantage effect in tennis that significantly varies by player race and tournament location. As an example, compared to Caucasian players, we find Southern players to have a significantly larger home advantage effect, whereas Asian players have a significantly lower home advantage effect than Caucasian players. In addition to the home player’s race, we find the opposing player’s race to be a relevant determinant of the home advantage effect. For instance, home advantage effect is decreased for Indian players when facing a black opponent; similarly, we find a significantly lower home advantage effect for Southern players competing against Asian players.
Judged events at the Olympics: do the determinants of success differ?
- Gergely Csurilla, Institute of Economics, Centre for Economic and Regional Studies, Budapest, Hungary; Sport Economics and Decision Making Research Centre, Hungarian University of Sports Science, Budapest, Hungary
- Imre Fertő, Institute of Economics, Centre for Economic and Regional Studies, Budapest, Hungary; Institute of Agricultural and Food Economics, Hungarian University of Agriculture and Life Sciences, Gödöllő, Hungary
Introduction
Countries hosting the Olympic Games typically allocate extra resources to their elite sports as soon as they are selected. On the one hand, to support their athletes to take advantage of the home field. On the other hand, they are trying to justify the organisation of the event and the costs involved by the increased number of medals.
The existence host effect has been identified in all studies investigating the determinants of countries’ success at the Olympic Games. Forrest et al. (2017) were the first who estimated the previously used indicators separately by sport. The GDP per capita and the population size affect the results significantly in all events in the sample. However, not all the sports showed a significant effect for home advantage. The sports where a significant effect was found are typically those where subjectively judging affects the results. Balmer et al. (2001) have also achieved similar results for the Winter Olympics. In sports where the outcome is determined by the subjective judgements of the judges, the host effect has a greater impact. In a later study, this finding was also confirmed for the Summer Olympic Games (Balmer et al., 2003).
The host effect and the other determinants of success also show differences by gender at the Olympic Games. Gender differences between the Summer and Winter Olympics exist, with the host effect for women being largely insignificant at the Winter Olympic Games (Noland & Stahler, 2017; Singleton et al., 2021). Rewilak (2021) shows a similar positive home advantage for both genders.
Evidence for the judging bias in subjectively judged sporting competitions has been identified in individuals (Emerson et al., 2009) and also in country-level (Waguespack & Salomon, 2015). However, the difference in the determinants of success between judged and non-judged events has not been studied before. In this paper, we address this issue from different aspects.
Several issues arise from previous studies of the Olympic Games’ judged competitions. First, most studies had limited samples or observations. Second, the results are almost invariably based only on the total number of medals, with no gender differences examined. Finally, recent studies highlight the importance of newer empirical methods that could better handle the problem of zero observations in the Olympic data compared to the previously used estimators (Csurilla et al., 2021; Duráczky & Bozsonyi, 2020; Rewilak, 2021). In our study, we provide answers to all these issues.
Data and methodology
We employed data about medal counts of the Summer Olympic Games between 1996-202. Due to regime changes and boycotts in the 1990s, the results of earlier Olympics cannot be used for a longitudinal analysis (Forrest et al., 2017). Instead of aggregate data, we used the sport-level medal count to obtain more detailed information about countries’ Olympic performance (Singleton et al., 2021). We used data from the database of the World Bank for the socioeconomic indicators.
We used the Olympic medal counts of countries for sports (total, men, and women) as the outcome variable. The logarithmic forms of GDP per capita and population, host dummy, communist dummy, and a super dummy for controlling the outstanding performance of the three superpower countries (the USA, China, Russia) were applied as explanatory variables. As having a sports-level panel dataset, we included two-way fixed effects in the models to control heterogeneity over time and across sports (Singleton et al., 2021).
To measure the determinants in judged and non-judged events, we split our sample into three parts; judged, non-judged, and team sports. As the number of observations in team sports is low, these were excluded from the analysis. The estimations were performed for judged and non-judged samples and by gender separately. To handle the issue of mass zero observations in the outcome variable, a zero-inflated negative binomial (ZINB) regression was applied as an estimator (Hilbe, 2014).
Results
We first estimate the models on the full sample. Only one coefficient is not significant in one case. The super dummy shows no effect on the medals won by men. In addition, all other variables have a positive effect on the Olympic medals.
When we split the data by the type of event, the coefficients of host effect, superpower countries, communist dummy, and the GDP per capita in the zeroinflate model change remarkably. The super dummy loses its significance in judged and men events. The technological advantage of the three countries is likely to be more pronounced in non-judged events. In all cases, the host effect is slightly higher in the judged events. This suggests some judging bias; however, the differences are not statistically significant. Coefficients of the communist dummy are significantly higher in the judged events also for men, women, and total medals. Former communist countries might focus more on judged sports.
One of our most interesting findings is that the GDP per capita positively affect the probability of not winning a medal in judged events in the case of total and men’s medals. This odd result may be explained by the hectic nature of the judges’ actions. Or that many of the wealthier countries do not focus on these sports due to their hectic nature.
The introduction of a minimum wage in Germany and the effects on physical activity
- Sören Dallmeyer, German Sport University, s.dallmeyer@dshs-koeln.de
- Christoph Breuer, German Sport University
Introduction
On the 1st of January in 2015, the German government introduced the first statutory uniform minimum wage of 8.50€ per hour in the history of the country. Over the following years, the minimum wage was gradually raised to 8.84€ in 2017 and 9.19€ in 2019. With around 4 million people being affected by the regulation (Lesch & Schröder, 2016), the decision by the policy-makers to intervene was in particular driven by the aim to prevent poverty and to reduce income inequality among the German population (Kalina & Weinkopf, 2014).
In the past, both economic indicators have been proven to affect numerous dimensions of an individual’s health in Germany (Aue et al., 2016; Picket et al., 2016). Accordingly, previous research has also focused on the relationship between an introduction or an increase of a minimum wage and numerous health outcomes. In fact, Leight et al. (2018) found in their recently published review that the number of studies investigating this relationship has increased rapidly over the last couple of years. For example, research has found a positive effect of an increase or the new introduction of a minimum wage on self-reported health (Lenhart, 2017), mental health (Reeves et al., 2017), obesity (Andreyava & Ukert, 2018), and birth weight (Strully et al., 2010). The evidence on health behavior, in particular physical activity, however, is rather scarce, in particular when it comes to participation in physical activity. Hence, this study investigates if the introduction of the minimum wage in Germany has affected the physical activity behavior of the German population.
Conceptual framework and literature review
From a theoretical perspective, Horn et al. (2017) explain the positive health outcomes of a minimum wage by using a simplified version of the Grossman model (1972). This economic model on the demand for health and healthcare assumes that every individual has a durable capital stock of health which depreciates over time at a certain rate and by investing in either market goods or non-market goods the individuals can restore their health. Horn et al. (2017) noted that minimum wages are unlikely to affect neither the capital stock of health nor the depreciation rate but instead can have an influence on the individual’s investment in their health by affecting the income level and time costs. With a higher income, people can consume more market goods to improve their health.
However, they can also use the higher earnings to consume non-healthy goods such as alcohol or smoking. For time costs the potential effect is twofold as well. With a higher income the opportunity costs of time increase which can have a diminishing effect on the consumption of non-market goods. On the other hand with the potential negative effects on employment in mind, it is possible that people will experience lower working hours which can lead to more time for the consumption of non-market goods.
The existing literature has investigated the effect of minimum wages in particular on smoking and alcohol consumption. While Leigh et al. (2018) were able to find a significant decrease in smoking behavior in their review of existing studies, the findings regarding alcohol consumption were rather inconclusive.
Surprisingly, physical activity has not received much academic attention, yet. Only the study from Horn et al. (2017) has looked at this relationship as part of an auxiliary analysis. The researcher used a very broad measure of physical activity (exercise in the last 30 days, yes/no) and found evidence that women are more likely to report physical activity following a minimum wage increase. The relationship to physical inactivity is interesting because of numerous reasons. First of all, the wide range of health problems associated with physical inactivity, well-documented by existing research, makes it one of the major public health challenges. Accordingly, governments worldwide are looking for policy interventions to promote physical activity among the population. Second, the two outcomes of minimum wages, higher income levels, and time costs have been identified as important determinants of participation in physical activity in the past. Humphreys & Ruseski (2012) have investigated both and found that a higher income has a significant positive effect on participation in physical activity. However, regarding the increase in times costs, the authors found that the higher levels of income had a significant negative relationship with duration of participation, likely due to the higher opportunity costs. In a follow-up study, Humphreys & Ruseski (2015) revealed that this two-fold effect is likely depending on the kind of physical activity. For example, a higher income is positively associated with participation in swimming or golfing, whereas a negative effect was found for walking or exercising at home. Due to those findings, the relationship between minimum wages and physical activity is likely to differ between the decision to participate and the duration of participation.
Our study aims to shed further light on this relationship by using more detailed measures of physical activity. The data stems from the German Socio-Economic Panel which includes detailed information on the working conditions of the individual. Additionally, two different measures of physical activity are available: One measuring the frequency on an ordinal scale from never to more than once a week and one measuring the numbers of hours participating in physical activity per working day.
Methods
The analysis of the relationship between the introduction of a minimum wage and physical activity is based on the German Socio-Economic Panel (GSOEP) (GSOEP, 2021). The GSOEP is a German household panel survey conducted annually by the German Institute of Economic Research since 1984. In previous research, the survey data has already been utilized to examine determinants (Breuer & Wicker, 2008) and outcomes of physical activity (Lechner, 2009). With regard to the introduction of a minimum wage, the GSOEP has been used to investigate numerous employment effects (Caliendo et al. 2018) and Gülal & Ayaita (2018) looked at the effect on various well-being outcomes.
With the minimum wage being introduced in 2015 and adjusted in 2017 and 2019, the present study uses data from the period 2013-2019.
Given the focus of the analysis is on the minimum wage, only individuals of the official working age in Germany (16-65 years) are included. The final sample size of the study consists of n=18,657 with n=4,841 respondents before the introduction of the minimum wage in 2013 and n=13,816 after the introduction in 2015, 2017, 2019
The study applies a difference-in-difference (DiD) approach to estimate the causal effect of the introduction of minimum wage in 2015 on physical activity in Germany. The DiD captures how the participation in physical activity in the treatment group changes in comparison to the control group. Thereby, the treatment group consists of individuals who receive an hourly wage below 8.50€ before the new minimum wage was introduced in 2015. The control group captures individuals who receive an hourly wage higher than 8.50€ but only up to 12.75€ (50% more).
Preliminary findings
The results show a significant positive effect on the number of individuals being active once a week and on the duration of physical activity when comparing the treatment to the control group. A differentiation by gender revealed that the positive effect of a minimum wage for participation frequency and duration can only be observed for females. Further, the analysis does not show any additional effects of the different raises of the minimum wage level in 2017 and 2019.
The well-being, health, and social value of grassroots football in Europe: Gender-based insights
- Paul Downward, Loughborough University, p.downward@lboro.ac.uk
- Pamela Wicker, Bielefeld University
- Tim F. Thormann, Bielefeld University
Introduction and motivation
In recent years, public policy has promoted sport participation across Europe because of benefits to health (Downward et al., 2021), social capital (Davies et al., 2019), and well-being (Downward & Dawson, 2016; Huang & Humphreys, 2012; Ruseski et al., 2014; Wicker, 2020). Whilst it has long been argued that greater sport (and physical activity generally) can help to reduce health care costs (Dallmeyer et al., 2017; Ding et al., 2017), increasingly social return on investment (SROI) analyses have emerged. These investigate the case for increased investment in sport aimed at drawing down the benefits associated with sports beyond the economic impact arising from tangible consumption expenditures (Davies et al., 2019). A key feature of SROI analyses is the need to monetize the returns from such investments that, due to their intangible nature, represent non-use values. The compensating variation or well-being valuation approach is one example of how this can be achieved (Orlowski & Wicker, 2019; Thormann et al., 2022). This study makes use of this approach to answer two research questions connected with football in Europe:
- How does participation in different types of football affect male and female social capital, well-being, and health?
- What monetary values can be assigned to these effects?
The focus on football is for three reasons. First, it is typically the largest participation team sport (Lechner & Downward, 2017). Second, and shared with some other sports, football participation can take place in a variety of formal and informal contexts (Jeanes, 2019). Finally, it is a sport that is rapidly developing for females and challenging existing patterns of sport participation (Pfister, 2015). Addressing the research questions in this context can inform future investment by governing bodies.
Theoretical foundations
The compensating variation approach that is drawn upon has its roots in microeconomic theory (Fujiwara & Campbell, 2011; Orlowski & Wicker, 2019). This approach postulates that a set of factors influence well-being, social capital, and health, and these include the forms of football that they participate in. Identifying the contribution of both the football participation and the individual’s income to the outcomes of interest allows for the monetization of the contribution of football to that outcome. A large literature has identified the contributions of sport to the outcomes investigated (e.g., Kumar et al., 2019). However, less have identified the monetary values associated with the outcomes associated with sport – with a few exceptions (Downward & Rasciute, 2011; Downward & Dawson, 2016; Orlowski & Wicker, 2018; Thormann et al., 2022).
Empirical approach
The analysis draws on survey data collected from February 22nd to March 8th, 2021 from respondents recruited from the online consumer panels of Toluna. Sub-samples of 1,000 individuals were gathered for the UK, Germany, Italy, Poland, Romania, Russia, and Sweden, and 500 individuals from Bosnia, resulting in a full sample of n=7500 respondents. The aim was to capture different geographic segments of the football market in Europe. The country-specific sub- samples were nationally representative in terms of age, gender, and income. Country-specific sub-samples included at least 400 footballers, except for Bosnia, to provide sufficient observations to draw a contrast between participation or not given the relatively low levels of participation in team sports in general and football in particular.
A questionnaire was developed to measure the outcomes of health, well-being, and social capital drawing on questions for previous large-scale surveys such as the Taking Part Survey in the UK (Downward & Dawson, 2016) and the German Socio-Economic Panel (Orlowski & Wicker, 2018). Specifically, subjective well-being was captured with a question assessing individuals’ general happiness on a scale from 0 to 10. Individuals’ health was measured with a subjective statement about the perceived general health status (on a five-point scale). Social capital was captured with a question asking for the perception of how much people can be trusted in general on a scale from 0 to 10.
The independent variables of interest are the forms of respondents’ football participation, gender, and a number of confounding factors (e.g., age, number of children, educational level, being a couple, watching football, income). The different forms of football included: formal 11-a-side football, small-sided football (at a facility), futsal, informal football (in a public space), and walking football. Importantly, given the timing of the sampling period, respondents were asked to answer the questions based on the season before the Covid-19 pandemic arrived.
The empirical analyses consisted of a set of regression analyses identifying the associations between the different forms of football to the three outcomes of subjective well-being , health, and trust. These estimations were repeated for the gender-specific sub-samples. In the case of significant effects of the football participation and income, the well-being valuation approach could be employed. The estimated Euro value explains how much income individuals would be willing to forego in order to be able to continue participating in different forms of football, while staying at the same level of well-being or other outcome (Orlowski & Wicker, 2019).
Main results
Overall the results indicate that both organized and informal football are associated with greater well-being, social capital, and health in Europe, though the associations are absent for more organized football for males (11-a-side, small-side and futsal) and health. The results also suggest that the largest monetary values are associated with social capital for both males and females. Of particular significance is that even though females participated less in all five types of football participation, their well-being, social capital, and health benefits were estimated to be higher than males. These findings are consistent with the higher marginal values associated with relative scarcity in micro-economic theory, but also highlight the importance of continuously promoting organized football participation for women across national associations in Europe. Collectively, the present findings suggest that investments in women’s football at the grassroots level yield high social returns on investments, at least at the individual level of football participants.
Much Ado about Nothing? Referee Bias and Match Results in the United Rugby Championship
- Paul Downward, Loughborough University, p.downward@lboro.ac.ul
- Pat Massey, Compecon Limited
- Peter Dawson, University of East Anglia
- Vincent Hogan, University College Dublin
Introduction and Motivation
It is argued that fairness is integral to sport, which as Dawson et al. (2019) argue, reflects the ethical and moral dimensions that developed with modern sport in England and is captured in codes of ethics. In this regard ‘Fairness refers to practising a sport while faithfully respecting the rules of competition….’ (Council of Europe, 2010, para #10). Match officials play an important role in facilitating fairness in competition, with the role developing from a historic need to ensure that newly codified rules and laws of games are followed, with officials thus becoming endowed with the having the authority to rule on disputed actions (Collins, 2010; Rains, 1984). It is also long recognised, however, that official bias is exhibited in the discretionary decisions made by officials, such as sanction decisions (Nevill & Holder, 1999). What is less well researched is the impact that this might have on match results. This paper thus addresses this issue by answering the following research questions in the context of United Rugby Championship (URC) matches (The URC was originally launched as the Celtic League in 2001/02 comprising teams from Ireland, Scotland, and Wales. It subsequently expanded to include teams from Italy (in 2010/11) and South Africa (2016/17). It has undergone several name changes along the way.) .
- To what extent is there evidence of official bias in URC matches?
- Is their evidence that official bias influences match results?
Theoretical Foundation
The role of match officials can be understood from a Principal-Agent theoretical perspective in which, as an Agent, they act of behalf of sports organisations, as the Principal, to ensure that competitions take place according to the rules and laws of the games and that fair arbitration takes place. Authority is granted to officials becasue of the proximity that they have to the contest (Collins, 2010). This raises the potential for a ‘psuedo‘ moral hazard problem because the official has both an information advantage on why decisions are made and could take decisions that are not in the best interest of the game by exhibiting bias. The pseudo nature of the moral hazard problem arises because the bias might not be because of deliberate malfeasance (Dawson et al., 2019). In this regard the preferences of officials might be endogenous becasue they are influenced by contextual factors like the crowd who give cues as to what has happened (Garicano et al., 2005). Implicit or unconscious preferences might also influence decisions through sporting allegience (Dawson & Dobson, 2010). Given the pressure and time constrained nature of decisions (Aguirre-Loaiza et al., 2020), moreover, decison making might be influenced by experience (Garside et al., 2013). A large literature, thus, identifies that discretionary decisions of officials might contribute to home advantage. For example, officials award more penalties to the home team (Boyko et al., 2007), more red and yellow cards to away teams (Buraimo et al., 2012) and award more penalties and extra time when behind for home teams (Sutter & Kocher, 2004).
One of the main solutions to the moral hazard problem has been through the introduction of further monitoring of decisions. This has arisen through having more officials on the field (Dawson, 2014; Heckelman & Yates, 2003; McCormick & Tollison, 1984) and, more recently, the use of technology such as the DRS system in cricket (Shivakumar, 2018) and the Television Match Official (TMO) in rugby (Dawson et al., 2019). The evidence is not strong that monitoring improves the distribution of decisions.
In the context in which sports typically provides home advantage in matches this research seeks to explore the incidence of official bias and explore its direct and indirect potential association with match outcomes.
Empirical Approach
The analysis is based on a sample of 2,128 matches between 2003/4 and 2020/21 of the United Rugby Championship. The empirical strategy involves exploring the association between having a referee that matches the home or away team’s nationality (compared to being neutral) on the outcome of a home team win compared to a loss. The role that referee sanction plays is also explored. A measure of total sanction that combines the award of yellow and red cards as well as penalty tries is adopted following (Dawson et al., 2019)
The analysis is undertaken by generalised structural equation modelling (with a binary outcome) which identifies if match official nationality is directly associated with match outcomes, as well as being mediated by their sanction decisions. Confounding influences such as the scheduling of the match, the relative quality of each team the attendance at the match and matchday etc. are accounted for, as well as the zero attendances due to Covid-19 in the 2020-21 season.
Main Results
The main results indicate that increased match attendances and relative team strengths are associated with a greater likelihood of a home team win as might be expected and that absent crowds ameliorated this as identified in the literature. Moreover, the results identify that haveing an away team nationality referee is associated with a reduction in the likelihood of a home team win, but that both home and away team referee sanctio is not. However, home team sanction is shown to be negatively associated with having a home team nationality referee and positively associated with having an away team referee. A home team nationality TMO is also associated with increased away team sanction. Overall results suggest that referee bias is present in matches and in sanction, but the latter is not directly associated with match outcomes. The impication is that whilst referee sanction might be a discrete indication of bias, it is more likely that the momentum of decisions that might be driving results. This raises important issues for the nature of support and monitoring that might be employed in rugby in particular but perhaps other sports.
The (Surprising) Gender Earnings Gap in Winter Sports: The Impact of Pool Size on the Returns to Performance
- Bernd Frick, Paderborn University, bernd.frick@uni-paderborn.de
- Pascal Haase, Paderborn University
- Katrin Scharfenkamp, Bielefeld University
- Rob Simmons, Lancaster University
- Pamela Wicker, Bielefeld University
Introduction, theoretical background, and related literature
It is now a stylized fact that women working full-time earn about 20 percent less than men (Blau & Kahn, 2017). Controlling for self-selection into particular industries/jobs reduces this gender pay gap to about 10 percent. However, even in identical jobs women earn significantly less than men (Adams-Prassl, 2020; Bolotnyy & Emanuel, 2022; Cook et al., 2020). These gender differences in earnings have been explained from at least three perspectives. The first perspective relates to discrimination, with gender earnings gap representing a form of treatment discrimination (Cunningham, 2019). This means that women earn significantly less despite having the same human capital and performance levels as their male counterparts (Wicker et al., 2021). Treatment discrimination frequently results from access discrimination, as women have less access to better paid positions (Burton, 2015). Gender earnings gaps among elite athletes were evident in some studies (e.g., Flake et al., 2012; Wicker et al., 2021), but not in others (Wicker et al., 2012ab).
The second perspective relates to customer discrimination, meaning that the men’s game generates more earnings because it is considered more prestigious and more people watch it (Humphreys, 2000), essentially blaming the customers’ interest for any evident gender gaps. Within sport organizations, these revenue differences are then forwarded to the respective athletes (Wicker & Thormann, 2021), implying that male athletes (or coaches in men’s sports) generate higher earnings than their female counterparts. This perspective has been confirmed for athletic administrators and coaches (Ament, 2017; Humphreys, 2000; Osborne & Yarbrough, 2000; Stier et al., 2010). The third perspective relates to gender differences in individual attributes. For example, differences in competitive orientations, non-cognitive skills (e.g., confidence and assertiveness) and preferences regarding family and career have been found to explain a large part of the remaining difference (Grove et al., 2011; Niederle & Vesterlund, 2011). However, other research within sport found no gender differences in competitiveness (Krumer et al., 2016). Hence, from this perspective, the assumption is that when adequately controlling for human capital, self-selection, non-cognitive skills, and mental dispositions, women should earn as much as men do.
Research context and research question
Obviously, sport is a natural laboratory to test this prediction because among male and female professional athletes, differences in preferences and mental dispositions should be negligible. Alpine and in Nordic skiing are among the few individual sports where the level as well as the distribution of prize money is identical for men and women. In Alpine skiing, prize money is provided for the top 30 finishers of each event, in Nordic skiing for the top 20 only. The total amount of prize money in Alpine skiing is at least 120,000 CHF per event (some organizers offer larger amounts for men as well women) and 40,000 CHF in Nordic skiing (here too, some organizers offer (slightly) larger amounts of money).
In both sports, the winner of each event gets 100 World Cup points, the runner-up 80 points and the athlete on third place 60 points. The athletes finishing 29th still receive two points and those finishing 30th are awarded one point. Thus, not only the prize money and its distribution is identical for men and women, but also the points system.
Since there is no pay gap at the end of the organizers of sport competitions, female and male athletes should earn exactly the same amount of prize money (additional income from endorsement contracts is usually not disclosed, as it remains private and confidential). This study advances the following two research questions: (1) when examining athletes’ earnings in Alpine and Nordic skiing, is there evidence of a gender earnings gap? And (2) if so, how can such a gap be explained?
Method
The research questions are examined using data covering ten consecutive seasons of Alpine skiing (2012-2021) and 20 seasons of Nordic skiing (2002-2021). The data include 2,841 athlete-year-observations in Alpine skiing and 5,607 athlete-year-observations in Nordic skiing. They were retrieved from the official website of the International Skiing Federation (Federation Fédération Internationale de Ski; FIS; www.fis-ski.com). In the Alpine skiing dataset, we have 365 men and 313 women athletes, in the corresponding Nordic dataset the respective figures are 758 (men) and 583 (women), respectively. In Alpine skiing, the average annual prize money of women is 31,000 CHF, while that of men is 29,000 CHF. In Nordic skiing, the respective figures are 11,000 CHF (women) and 8,000 CHF (men).
The empirical analysis employs a set of panel regression models where the annual prize money serves as the dependent variable. The independent variable of interest is the gender dummy (1=female), which is accompanied by some control variables. These are the World Cup points accumulated by each athlete in the respective season and dummies for each skiing season. The first set of regression analyses are ordinary least squares (OLS) models followed by a Blinder-Oaxaca Decomposition. The second set of models are instrumental variable (IV) estimates taking into account the difference in the size of the pool of male and female athletes. Separate models are estimated for Alpine and Nordic skiing.
Results and discussion
The descriptive statistics show that the gender earnings gap is around 1,700 € in Nordic skiing and 4,000 € in Alpine skiing. The results of OLS models indicate that women athletes earn significantly less than men athletes. The results of the Blinder-Oaxaca decomposition confirm the evident gender earnings gap and suggest that female athletes should earn more as they perform better in terms of accumulated World Cup points. The question is how this definitely surprising result can be explained. A closer inspection of the data reveals that in each season the number of female athletes is lower than the number of male competitors, suggesting that the average female athlete accumulates significantly more World Cup points in a particular season than the average male athlete (the respective figures are 186 (Nordic) and 191 points (Alpine) for women and 134 (Nordic) and 168 points (Alpine) for men). Thus, for women athletes the monetary returns to performance might be lower because the number of athletes is lower. When we estimate the prize money model with an IV regression which considers the difference in the size of the pool of male and female athletes, the gender earnings gap completely disappears.
Collectively, standard econometric tools suggest that female athletes in Alpine and Nordic skiing earn less prize money than male athletes. Since the level as well as the distribution of prize money is identical for men and women as is the World Cup points system, the evident gender earnings gap is due to the smaller pool of female athletes. Hence, it is not possible to conclude that female athletes in these sports are discriminated. Specifically, given the absence of customer and treatment discrimination since pay from the event organizers is identical and differences in preferences and mental dispositions are negligible, a different explanation needs to be put forth. Consequently, this research suggests that a fourth perspective, i.e., the size of the pool of contestants, should be added to the set of explanations for gender earnings gaps. Such a situation could also be present in other settings beyond skiing and elite sports. It may well be that in other environments, where the number of female contestants is low, gender earnings gaps might exist that are also entirely due to self-selection.
The influence of positive and negative feedback on professional performance
- Daniel Goller, University of Bern, University of St. Gallen
- Maximilian Späth, University of Potsdam, maximilian.spaeth@uni-potsdam.de
Introduction
Providing performance feedback is one of the main tasks of a company’s management bodies, and, according to Morgeson et al. (2010), one of the main tasks of organizational leaders. An important aim of feedback is to create a favourable emotional response. At best, feedback can motivate employees and increase their productivity. In the worst-case, it leaves the employees frustrated and unproductive. Therefore, decades of literature have analysed how to optimally give feedback (Balcazar et al., 1985; Alvero et al., 2001; Sleiman et al., 2020).
An important distinction is between positive and negative feedback. Many employers or other evaluators are reluctant to give negative feedback (Rosen & Tesser, 1970; Larson, 1986; Cheng et al., 2017). Indeed, some research shows adverse effects of negative feedback on subsequent motivation (Deci & Casico, 1972; Weidinger et al., 2016) and that the impact of negative feedback is less favorable than of positive feedback (Vallerand & Reid, 1988; Fong, et al., 2019). Yet, other studies find a favorable effect of negative feedback (Carpentier & Mageau, 2013; Choi et al., 2018). In some studies, the effect of negative feedback is as favorable as positive feedback (Johnson et al., 2015; Itzchakov & Latham, 2020). Other research even finds a more favorable effect of negative feedback (Waldersee & Luthans, 1994; Podsakoff & Farh, 1989). Hence, previous literature cannot provide a clear answer to the question of how positive and negative evaluations distinctly impact the productivity of individuals.
Our contribution is the analysis of the impact of negative and positive feedback in a highly competitive and international environment: professional sports. We consider ski-jumping and diving competitions. These sports have in common that athletes’ performance is evaluated by judges in consecutive rounds. We focus on the most positive and the most negative evaluation(s), which are discarded in the scoring process. These non-consequential evaluations impact subsequent performance exclusively through the behavioral motivation channel. The main advantage of our approach is that the feedback is quasi-random, while being truthful and meaningful. The advantage of using sport data is that it provides quantifiable measures and a wealth of information usable for scientific research (Kahn, 2000), occurring in natural, non-laboratory, situations with real incentives (Levitt & List, 2008) (Settings as in our data are especially good for research (Goller, 2022), as there are highly standardized conditions, almost no external influences, clear rules, and no direct interactions between the contestants.). The international nature of our data extends the research to individuals coming from non-WEIRD (Western, Educated, Industrialized, Rich, and Democratic) (Henrich et al., 2010) societies.
Data and empirical strategy
To investigate the role of feedback on subsequent performance, we collected data on different types of sports – ski-jumping, and diving (1m and 3m springboard, 10m platform) competitions. With (male) ski-jumping athletes, we analyse professional athletes in a sport in which prize money is high; in diving we find people that can barely make a living from their sports alone and are less professionally organized. Another difference is the more equal attention to both genders in diving, compared to ski-jumping, in which male athletes earn way more attention, and money. Furthermore, the evaluation process by judges and the contest design differ between the mentioned sports, helping us to analyse the robustness of the effects.
In this work we exploit the non-consequential extreme ratings by judges that are disregarded from the score. While not relevant for the evaluated performance in the actual round, we argue that the disregarded non-consequential ratings are quasi-randomly (The literature found biases in judges’ evaluations, like nationalistic (Krumer et al., 2022) or other types of biases (Heiniger & Mercier, 2021), which we account for in our analysis.) assigned and impact the performance of the competitors in later rounds exclusively due to their influence on the competitors’ motivation.
Results
In the two investigated settings, ski-jumping and diving competitions, we find differential effects. While negative (discarded) ratings have no effects, positive (discarded) ratings have a positive impact on performance in later jumps. In ski jumping we cannot analyse the preliminary rounds because they consist of a single jump, whereas in diving the athletes do several jumps in each round, including preliminary rounds or semi-finals. We find the positive effect on positive feedback for the (more professional) ski-jumping athletes, as well as for diving competitors, albeit only in the finals. In preliminary rounds, we find neither an effect for negative, nor positive ratings.
In finals, all performances count for the final ranking and are thus relevant for World Cup points and/or prize money. In the preliminary rounds it is sufficient to rank among the best, e.g., 12 athletes, whereby the position itself is irrelevant. Preliminaries are therefore different from the finals in the sense that in the finals every athlete tries to get the best out of every jump, whereas in the preliminaries not every jump has the same importance. This could explain the different translation of feedback into motivation and performance.
Conclusion
Our study contributes to the literature on feedback in the professional context analysing settings in sports competitions in which feedback and outcomes are clearly measurable and observable. Our findings are relevant for managers and executives in charge of providing feedback to their employees. Our preliminary findings indicate that positive, motivational feedback helps professionals to increase their performance, though only in situations in which performance really matters.
The Impact of Absent Coworkers on Productivity in Teams
- Sam Hoey, Erasmus School of Economics, Tinbergen Institute and Erasmus Center for Applied Sports Economics
- Thomas Peeters, Erasmus School of Economics, Tinbergen Institute and Erasmus Center for Applied Sports Economics, peeters@ese.eur.nl
- Jan van Ours, Erasmus School of Economics, Tinbergen Institute and Erasmus Center for Applied Sports Economics
Introduction
Since the start of the Covid-19 pandemic most developed economies witnessed a dramatic increase in the absenteeism of workers from their jobs. This phenomenon directly increases various social security costs, such as sick pay and furloughs, but it may also depress the output firms produce, particularly when production involves teamwork. This output loss has two potential causes. First, the firm is typically unable to replace the absent worker by a worker of similar ability, resulting in a direct loss of production (Herrmann and Rockoff, 2012). Second, the remaining coworkers of the absent worker may become less productive because their productivity depends on the ability of their absent (and replaced) coworker (Bartel et al, 2014). In this paper we study both the direct effect that the replacement is worse than the absentee, and the indirect effect, that remaining players perform worse. In doing so, we gauge the relative importance of both effects in terms of team performance loss.
In our empirical setting all absent workers are replaced, but replacement workers are on average less skilled and less experienced than absentees. Our analysis distinguishes between two types of absentees, those who perform the same task in the team (substitutes) and those who perform a complementary task. The absence of both types of coworkers has a negative impact on the productivity of the remaining ever-present workers, as they produce less output per minute worked. When a substitute worker is absent, the remaining workers compensate this productivity loss by increasing their own working time. The replacement worker typically takes over only a portion of the working time of the absent coworker, while remaining workers fill in the rest. In output terms, this increase in working time counteracts the loss of worker productivity per minute worked for the ever-present remaining workers. As such, the absence of complementary workers has a more severe impact on the output produced per remaining worker. The productivity loss for both types of absences is strongest for the least able remaining workers, who also compensate more in terms of working time. At the team level absenteeism decreases total production through a combination of the productivity loss of the remaining workers and the lower ability of replacement workers compared to the absent worker.
Methods and data
To perform our analysis, we use a detailed game-by-game database of performance and injuries in the National Hockey League. We measure the individual output of each offensive player in the league by the number of goals scored per game. The team level output per game is then the number of goals scored by the set of all offensive players in a team. We exploit teammate injuries as a plausibly exogenous health shock to worker performance by investigating how the individual and team output evolve in the games before and after another offensive player (substitute worker) or defensive player (complementary worker) gets injured.
The primary aim of this paper is to quantify the effect of coworker injuries on the output, productivity and working time of the permanent workers. The first step in doing so is to establish a regression framework, yielding statistically testable results. To this end we estimate the following models
Y_itm=β_0+β_1 〖Post〗_m+γ_m+ε_itm
where Y_itm is a vector of dependent variables containing the number of goals scored, working time and goals scored per minute for player i in game t relative to injury m. We regress these variables on an indicator variable, which is equal to 0 if game t is before injury m and equal to 1 when game t is after injury m. Finally, we include injury fixed effect γ_m, such that the change in the dependent variable as measured by β_1 is relative to the measure period’s average.
In additional analyses, not reported in this abstract, we examine the implications of these findings for team-level production and the heterogeneity of the effect on permanent workers of differing abilities.
Main Result
Table 1 reports the parameter estimates corresponding to Equation 1. The first row presents the results in case a substitute player is injured; the second row shows the results in case of injured players who were complementary, i.e. in case of an injury of a defense player. Column (1) shows the effect of a coworker injury on the output, measured by goals scored. The results indicate that always players do not experience a change in their output following a substitute teammate injury. Column (2) shows the results for productivity, measured by goals scored per 15 minutes. Here, we find that the always worker group experiences a significant drop in their productivity. On Average, they score approximately half a percentage point fewer goals per 15 minutes of work. Interestingly, we find that always players play 0.36 minutes more per game post injury in comparison to before the injury, which combined with the drop in productivity explains why there is no effect on output. The second row shows that the parameter estimates are very different in case of a defense injury. As was to be expected, the working time of the offense players is hardly affected by a defense injury. However, average productivity goes down significantly and so does output. The drop in productivity of the always players is even larger in case of a defense injury than it is in case of an offense injury.
Table 1
Rugby performance
- Vincent Hogan, University College Dublin
- Peter Dawson, School of Economics, University of East Anglia
- Paul Downward, School of Sport, Exercise and Health Sciences, Loughborough University
- Patrick Massey, Compecon – Competition Economics
Introduction
“Sports data provide a valuable opportunity for empirical testing of hypotheses arising from theoretical analyses of games, incentives, and strategies in economics” (Lenten, Libich and Stehlík, 2013: p. 646). Our paper analyses the performances of Rugby Union teams in the United Rugby Championship (URC) (The URC was originally launched as the Celtic League in 2001/02 comprising teams from Ireland, Scotland, and Wales. It subsequently expanded to include teams from Italy (in 2010/11) and South Africa (2016/17). It has undergone several name changes along the way.). Analysing team performances may provide valuable information for the organisation and design of tournaments as well as for team management (Ortega, Villarejo & Palao, 2009). Previous studies have considered teams’ responses to changed incentives (Lenten & Winchester, 2015) as well as the effectiveness of team strategies in terms of winning matches (Lohawala & Rahmen, 2018; Ortega et al. 2009). Analysing team performances may also identify player shirking. The proposed paper analyses the impact of attendances on team performances as a potential contributory factor to home advantage, a widely observed phenomenon in many professional team sports (Nevill & Holder, 1999).
Theoretical Foundations
The literature on sports performance has addressed a range of issues. One line of analysis has sought to identify actions or strategies that increase teams’ likelihood of winning. Ortega et al. (2009), for example, sought to identify differences in performance measures between winning and losing teams in Rugby Union’s Six Nations Championship, while Delbianco, Fioravanti & Tohmé (2021) conduct a similar analysis of English Premiership Rugby. Lohawala & Rahmen, (2018) investigate whether, in international cricket, winning strategies in five-day and one-day matches are different.
A second line of research has focused on team responses to changed incentives. Several studies have considered teams’ responses to bonus points in Rugby Union tournaments for scoring tries and losing narrowly, designed to promote more attacking play and encourage teams to exert greater effort in circumstances where winning is unlikely (Butler, Lenten & Massey, 2019; Fioravanti, Nemez, Tohme & Delbianco, 2019; Lenten & Winchester, 2015; Winchester (2014). In contrast, Hogan & Massey (2018) consider teams’ responses to changes in the relative values of different scoring methods in Rugby Union.
A further line of research has addressed the issue of player shirking. Koyama & Reade (2009), for example, suggest that a decline in home advantage over time in English football may be linked to increased live broadcast of matches which increases the ability of fans to monitor player performance in both home and away matches, reducing the scope for player shirking in the latter.
A separate line of research in the sports economics literature focuses on the widely observed phenomenon of home advantage in professional sports leagues. Much of this literature has focused on the impact of crowds on refereeing decisions as a significant factor in home advantage (Boyco, Boyco & Boyco, 2007; Dohmen & Sauermann 2016; Dawson et al., 2019 & 2022).
The present paper adopts a different approach in considering the impact of crowds on team performance/effort. It also provides further evidence on differences in performance between winning and losing teams.
Empirical Approach
The analysis is based on 1,050 United Rugby Championship matches from 2012/13 to 2019/20. We exclude from the sample all matches that took place during covid epidemic, i.e., from the latter part of the 2019/20 season onwards. We follow Ortega (2009) in identifying several intermediate measures of performance (such as success in tackles etc) which may be expected to affect overall match score. We regress the difference between the home and aways team’ performance measure on the attendance at each match and other control variables. The attendance variable used is the attendance as a percentage of stadium capacity.
Results
Table 1 shows the first set of regressions. In the first column the dependent variable is the difference between the home and away teams’ points scored in each match. The results in the first column show that attendance has a positive and significant effect on the home team’s score relative to that of the away team. This, of course, is the home bias phenomenon. The next three columns look at to what extent attendance also impacts intermediate measure of performance. Attendance boosts the home team’s tackle success rate and its possession win rate. It also boosts the home teams run rate but has no effect on the territory won or the CB rate. Table 2 continues the analysis with some other measures of performance It appears that neither relative ruck, maul, scrum or lineout success rate are affected by attendance. We plan to conduct further analysis of the data using a recursive system model as in Carmichael & Thomas (2005).
Table 1: Performance Measures 1
Table 2: Performance Measures 2
Revisiting the uncertainty of outcome hypothesis: The role of away supporters
- Brad R. Humphreys, Department of Economics, College of Business and Economics, West Virginia University, brhumphreys@mail.wvu.edu
- J. James Reade, Department of Economics, School of Politics, Economics and International Relations,University of Reading, j.j.reade@reading.ac.uk
Abstract
The notion that the consumers of sport events are influenced by how uncertain the outcome is of a prospective contest is taken as given. Yet the economics literature on the topic rarely tends to support the uncertainty of outcome hypothesis (UOH) ( Schreyer et al. 2018). Recent developments in understanding this paradox have focused on other explanations for observe fan choices: Coates et al. (2014) propose model distinguishing between pure consumption and gain-loss utility generated by deviations between expected and actual game outcomes. (Humphreys and Zhou, 2015) showed that testing UOH empirically is troublesome using pre-game betting odds, as it is difficult to distinguish between preferences for home wins, uncertainty and loss aversion.
All studies to date have considered that the fans observing a contest in the stadium are only interested in the home team. The common method to test for the hypothesis is to consider the pre-match bookmaker odds for the home team and their square, rather than consider the influence of the away team. In many sports this is simply the other side of the same coin, but in soccer for example, where the draw is a common outcome, this is not necessarily the case. However, in English football the away team tends to take up around 13 % of the total attendance, on average, a non-negligible component. In this paper we explicitly consider away fans and their motivation for attending.
Over the last decade and more in English football, in particular in the lower leagues where the variation is more significant, it has become common practice to announce attendances both in terms of the total fans in attendance, and the visiting supporters in attendance. Clubs will report this audibly in the stadium, and also on social media, most notably Twitter.
As such, our data is collected manually from Twitter, but also from websites that collect the data across entire divisions, like fanbanter.co.uk. We also collect information from the stadium managers at Oldham Athletic AFC, and Reading FC.
The full dataset of matches goes back to August 1993, the point that the www.football-data.co.uk website goes back to. We additionally collected information from www.footballwebpages.co.uk for attendances at matches, and stadium co-ordinates for calculating distances from www.worldfootball.net. In total, this amounts to 73,972 matches, where the average attendance is 9,762.
From the various sources of information, we have the number of travelling fans for 3,475 matches. That subset of over 3,000 matches appear to be quite representative of the data overall, since the mean number of home fans, and the mean number of away fans, sums to within 10 of the overall sample attendance mean.
To measure the likely outcomes of a match, to capture the level of uncertainty, we use betting odds from Bet365, and these are presented. The mean odds for a home win are 0.435, which is remarkably close to the likelihood of a home win throughout the sample (0.434). The Bet365 average odds for the away win are 0.297, a little below the actual proportion of matches ending as away wins in our sample, at 0.329.
On average, teams travel 114 miles to football matches in England, and the average local area with a football team in it has about 222,400 people in population.
Our results do point towards some element of the uncertainty of outcome hypothesis holding true. We find that for all fans in lower league English matches, where capacity constraints do not bind in general, there is a positive relationship between the home team’s likelihood of winning and attendance, and a negative, but insignificant, square of the likelihood. For visiting supporters, this relationship is yet stronger, with a significant negative coefficient on the squared term. These coefficients are indicative of the uncertainty of outcome hypothesis as they suggest a non-linear relationship in the likelyhood that a team wins a match. However, the implied peaks of attendance are extremely small, casting some doubt on the conclusions to be drawn.
Externalities of hosting mega-events in small communities: An econometric analysis of residential housing market
- Chan Hyeon Hur, University of South Carolina, hurc@email.sc.edu
- Nicholas Watanabe, University of South Carolina
- Brian Soebbing, University of Alberta
Theoretical foundation and related literature
Mega sports events generally claim to have large economic benefits for the host communities (Mills & Rosentraub, 2013) along with touting other positive impacts related to hosting such as legacy (Misener & Mason, 2006), economic and urban development (Scheu et al., 2019), and intangible impacts (Oja et al., 2018). However, prior research is plagued by the lack of empirical evidence, as well as an over-emphasis on utilizing macro-level data (i.e., GDP or stock indices) when examining potential regional impacts of hosting the events. Furthermore, as mega sports events are typically hosted in large communities with a significant amount of wealth and resources, any potential impact emerging from an event may be small in comparison, and thus, difficult to disentangle from other market activities (Agha & Taks, 2015). Recent examinations have found more localized market behaviors in relation to mega-events, including analysis of the real estate market (Kavetsos, 2012), housing demand (Ahlfeldt & Maennig, 2010), post-event use of host facilities (Cornelissen et al., 2011), and local labor market impacts (Hagn & Maennig, 2009). Findings from this line of research have noted the spatial proximity to host sites and stadiums has the potential to increase real estate prices as improved quality of life in the communities is capitalized into the residential property values (Feng & Humphreys, 2018).
Since quality of life is formed with various factors (e.g., transportation system, public safety, medical or recreational facilities, and city image), it has been estimated through housing demand (Ahlfeldt & Kavetsos, 2014; Tu, 2005). This capitalization of the sports event and facility construction/renovation into housing demand was developed based on the theory of consumer’s demand introduced by Lancaster (1966). Following this, the hedonic pricing theory settles on a function in which goods are valued by their characteristics (Rosen, 1974). In its usages, housing price is viewed as an additive function of its property and neighborhood characteristics (Xiao, 2017). For example, the former includes square footage, lot size, age of the property, whereas the latter contains pollution and noise level, crime rate, the availability of public transportation system, etc.
Importantly, distinguishing different residents’ perspectives towards the change in housing price has been debated over the explanation of gentrification (Hamnett, 2003). For instance, renters with low-income status are negatively influenced by the increase in their rental property values, causing relocation to cheaper rental areas, whereas homeowners or property investors may welcome the elevated values of their investments. In addition, from the government’s perspective, increased property tax collection is another revenue stream (Coates, 2007). Thus, with respect to all the aspects, finding more evidence of the externalities seems worthwhile.
Hence, this present research seeks to advance the understanding of potential economic effects and externalities of hosting mega-events by focusing on local-market measures of economic development. Specifically, this study analyzes the real estate market in PyeongChang, South Korea. This provides a unique context since hosting the 2018 Olympics was done in relatively smaller (sub)urban areas. Moreover, as changes in property prices can have various implications (e.g., profits for some property owners, a new revenue source for the government, and gentrification in the communities), the findings provide the ability to further discuss possible adverse externalities that may emerge from hosting the events. As such, this work advances the research into the intangible outcomes of mega-events, specifically regarding local-market effects for small host communities.
Method
For examination of the potential impact of hosting the 2018 Olympics on property prices in PyeongChang and other near regions in Gangwon province, the least populated province in South Korea, the current study utilizes a hedonic pricing model. By employing panel data consisting of 249,628 transactions from January 1st, 2008, to December 31st, 2019 (i.e., three years prior to the Olympic announcement in July 2011 to one year after the Games in February 2018) from the Korean Ministry of Land, Infrastructure, and Transport, this study applies the Difference-in-Differences (DiD) approach to find the net difference in property prices between host and non-host communities as it considers unobserved heterogeneity (i.e., spatial autocorrelation). Based on the estimations, this study examines whether the housing market in host communities experienced a discernable increase in real estate prices that can be attributed to the Games, covering the periods from before the selection of the host communities to after hosting the actual events (Models 1 and 2). Following this, this study delves into the impact of increased housing price on the low-income households along with other regressors (i.e., level of traffic accident, environmental pollution level, etc.) that refer to externalities of the event (Model 3). In addition, this study also examines the proximity effects of the major event-related venues on the real estate prices, covering the same periods (Models 4 and 5) with the same explanatory variables that also include the size and age of the property, crime level, number of public amenities, population of single parents and Korean, etc.
Results and conclusion
From Models 1 and 2, we found that the apartment prices of the host communities were 4.1% and 4.7% higher than the non-host communities after the announcement and hosting the Games, respectively. In addition, the coefficients of the number of low-income households in each community show a negative direction after the announcement, but a positive direction after hosting the actual Games. The direct interpretation would be that the more low-income households are correlated with the lower housing prices, while they are related with higher housing prices after the Games. Delving into this impact to examine possible gentrification, the simple mean comparison analyses from Model 3 show that the average number of low-income households per community increases by 22.6% after the announcement but dropped by 5% after hosting the Games. Furthermore, the results of Model 4 show that after the announcement, given one-mile increase in the distance from the venues, the apartment price is expected to decrease by .9%. However, the coefficients of Model 5 demonstrate no proximity effect, further indicating the value of the apartments in the host communities increases the most when the announcement is released, and over time all the apartments located in even farther areas experience this increase in their prices.
The findings of this study highlight that hosting the Olympics generally succeeds in increasing the property price in the host regions with different magnitudes and there are some proximity effects of the event-related facilities following the certain time periods, both of which provide some critical implications. The increased number of low-income households after the announcement might be due to the expected quality of life and some temporary job markets in the host regions. However, the decreased number after hosting the Olympics while the price still increases implies the possibility of gentrification in the host communities. From the other perspectives, the government may benefit from the increased tax collection and the investors from both inside and outside the host regions could also gain some profits. However, considering ripple effects from this increase to the national economy, interpreting only benefits of the increase is not convincing. If the price increases infinitely compared to the neighbor communities, it will create more gentrification for the residents, resulting in another chain of negative consequences in the overall economy where the government may spend more money to handle such issues.
The value of second-tier stars
- Fabienne Jedelhauser, University of Zurich, fabienne.jedelhauser@business.uzh.ch
- Raphael Flepp, University of Zurich
- Egon Franck, University of Zurich
Motivation
Undoubtedly, superstars like Lionel Messi and Cristiano Ronaldo are very talented football players and contribute essentially to a team’s sportive success. At the same time, they are known all over the world. In turn, have you ever heard of Lucas Digne or Sergi Roberto? Intuitively, it would be plausible if Cristiano Ronaldo was more important than Sergi Roberto or Lucas Dinge. The latter two however, although less known, are both very skillful players, but not as popular as superstars like Cristiano Ronaldo and Lionel Messi.
According to Rosen (1981) superstar status is based on differences in talent and only those with outstanding abilities reach the top of the market value distribution. This applies even if the differences in talent are small and get amplified through specific demand and supply conditions. From this perspective, we would expect superstars to have the greatest impact on team performance in football.
Adler (1985) in contrast, proposes an additional popularity-based avenue for superstar emergence. In environments, where new fans profit from network externalities by patronizing the most popular performers surrounded by the largest networks of existing fans, superstars may emerge even among equally talented individuals.
While popularity effects cannot substitute talent in a sport like football, there is ample empirical support for the observation that superstars in football entail elements of “Adler stars” (Carrieri et al., 2018; Franck & Nüesch, 2012). Since non-performance related factors like popularity contribute to superstar status to a non-negligible extent (Adler, 1985; Call et al., 2015; Carrieri et al., 2018; Franck & Nüesch, 2012), we are not able to rule out that individuals barely below superstar status – hereafter we refer to these individuals as second- tier stars – supply teams with comparable levels of talent but simply lack popularity.
Even though second-tier stars have not been directly addressed and defined in previous research, there are indications that they could be very valuable for overall team performance (Chen & Garg, 2018; Taylor & Bendickson, 2021; Wegelin et al., 2022).
So far, a direct comparison of the contributions of second-tier stars and superstars to team success is missing in the literature to the best of our knowledge. It is unclear how a second-tier star’s talent compares to that of a superstar, due to the second-tier stars’ potential lack of popularity. If we would compare superstars to average players in contrast, we would expect that a superstar’s talent outweighs an average player’s talent massively.
Empirical description
Our paper tries to fill this gap using data from the top five European football leagues from the 2016/2017 – 2018/2019 season. We collected information on players such as injuries, corresponding team affiliation, positions, and pre-season market values as well as information on team compositions from the website www.transfermarkt.com. Based on player’s injury reports we estimate the effects of unexpected variation in player availability on team performance. Injuries to players are plausibly exogeneous (Chen & Garg, 2018) and the absence of individuals is considered a useful measurement of marginal contributions (Carnahan et al., 2020). We collected the injury history of all players who played in a team of the top five European leagues. We obtained data on team performance from the website www.football-data.co.uk, a source that includes for each game the final result, the date and home team. Since all teams within a league playing each other twice during the season the full sample includes 5172 games, resulting in 10344 team performances.
Dependent variable. The dependent variable measures team performance in a single game in terms of the goal difference (Brandes et al., 2008; Franck & Nüesch, 2010; Peeters, 2018).
Independent variable. We classify players into superstars and second-tier stars relying on a league’s pre-season market value distribution, assuming that the market values represent a club’s cost for players (Peeters, 2018). We define superstars as players belonging to the top 5% of a league’s market value distribution (Franck & Nüesch, 2012), while second-tier stars are within the top 20% – 5%. In this respect we follow Wegelin et al. (2022) who define high performing individuals to be predominantly within the top 20%. To build the main independent variables we aggregate individual level information on players’ injuries to the team level. We form dummy variables that indicate whether a team is missing at least one player due to injury classified as superstar, second-tier star, or otherwise (players who are not in the top 20% of the market value distribution).
Estimation strategy. Our estimation strategy is based on OLS regressions including team, season and round fixed effects with standard errors clustered on games. We further control for the positions of injured players, whether a team played home or on the road, and the opponent strength in terms of an opponent’s last season final table rank.
Major Findings
We find that the unexpected absence of at least one second-tier star, defined as the top 20% – 5% of a league’s market value distribution, significantly reduces team performance in terms of the goal difference by -0.125, compared to a team with all players available. The coefficient of the absence of at least one superstar is smaller in magnitude (-0.0888) and not statistically significant. Although there is no significant difference between the marginal contributions of superstars and second-tier stars, our analysis reveals that a second-tier star’s talent is at least equal to that of a superstar. Our findings hold true for different measurements of team performance and for different operationalizations of our main independent variables of interest. In additional analyses we rule out that our effects are driven by a coach’s incentives to strategically rest key players.
Our paper contributes to the superstar literature in two ways. First, we extend previous literature on the potential disproportional performance contributions of superstars by directly comparing the marginal contributions of superstars and second-tier stars. Overall, our results suggest that second-tier stars are at least equally important to team performance as superstars in European football. Consequently, we disagree with the premise that star performers are the unique sources of human capital to achieve superior performance (Aguinis & O’Boyle, 2014; Taylor & Bendickson, 2021; Zucker et al., 2002).
Second, we contribute to the deeper understanding of superstars emergence in European football. Second-tier stars are underrated drivers of team performance compared to superstars. The underlying reason is that superstars in a high-popularity environment may achieve their status through notoriety, provided they possess the certain level of talent required at the very beginning. While talent-based avenues to superstar emergence (Rosen, 1981) are a prerequisite, popularity based explanations (Adler, 1985) serve as a complement and finally determine who makes it to superstardom. Our analyses indicate that superstars with top market values are not (or at least no longer) superstars because of their talent, but to a great proportion due to their popularity, at least at the top end of the market value distribution.
For decision-makers in football specifically, the focus on a second-tier star strategy rather than a superstar strategy may support clubs to partially offset pressure from various stakeholders to adopt a short-term orientation (Brechot & Flepp, 2020). Moreover, a second- tier star strategy represents a better cost-performance ratio compared to a superstar strategy and potential short term returns on investments of second-tier stars may outweigh short term returns on investments of superstars.
How Organizational Structure and Power Relations Impact Decision Making — An Empirical Investigation of General Manager Turnover in the NBA
- Xiaoan Huang, University of South Carolina, xiaoan@email.sc.edu
- Nicholas Watanabe, University of South Carolina
- Brian Soebbing, University of Alberta
- Donald Schepker, University of South Carolina
Contextual and Theoretical Background
The retention and dismissal of Chief Executive Officers (CEOs) has received significant attention within the general business literature (e.g., Conyon & He, 2011; Fee & Hadlock, 2004). Although there is limited consideration of executives in sport, scholars argued that general managers (GM) play a critical role within organizations, as they potentially impact the overall performance of teams through their acquisition of human resources (Juravich et al., 2017), which can also bring financial gains. While there is some understanding of the impact that GMs have on organizational performance in sport, there is a lack of consideration of the tenure of executives, and the factors that lead to turnover in these positions. In this, examining dismissals is important not only as a reflection of GM performance, but also in considering the decision-making of higher-level sport executives (i.e., presidents and owners).
Currently, the majority of empirical work in sport management studying the impact of management on firm performance focuses on coaches (e.g., Berri et al., 2009; Soebbing & Washington, 2011). While scholars argue coaches may play a similar role as a CEO in some sports organizations (Wangrow et al., 2018), it should be recognized that organizational performance may also be determined by GMs and owners. From this vantage, Wong and Deubert (2011) argue that GM is the most important position in a franchise, as they are generally involved in both business and on-field operations of the team. General findings suggest that GMs are able to improve the performance of teams by acquiring elite-level talent (Juravich et al., 2017), and that other factors such as technical experience and education level can improve winning and on-court efficiency. At the same time, research outside of the context of sport has widely acknowledged that the dismissal of executives can be related to factors beyond just performance (Barker et al., 2001; Fredrickson et al., 1998). As such, there is critical need for further examination of GMs in sport, especially as there is a lack of knowledge in regard to the tenure and dismissal of executives of professional sport franchises.
Methods
In order to examine GM dismissals in the NBA, we utilize 35 years of data (1985 to 2019) to analyze which factors determine executive succession in sport. Specifically, following the theoretical understanding developed in the management literature (e.g., Bilgili et al., 2017; Fredrickson et al., 1988), our model extends beyond just incorporating characteristics of the GM and team performance, but also measures other organizational factors (i.e. ownership structure, power dynamics, competition, and so forth). Each GM’s tenure is measured in yearly intervals that represent a GM at a specific team for a specific year. Following the definitions of Wangrow et al. (2018), we also define the dismissal at-risk period as the period from the start of one NBA season to the beginning of the next NBA season. In total, our data spans 994 yearly intervals (i.e., GM-years at risk of being dismissed) and involves 208 different GM tenures. 133 of the 207 GM tenures ended with dismissal, and 102 of those dismissals were non-mid-season dismissals. The majority of the data in this study comes from the websites: http://basketball-reference.com and https://www.nbahoopsonline.com. Both of these websites publish official NBA statistics and provide historical data on teams, players, coaches, general managers and ownership. Other main data sources include Rodney Fort Sport Business Data and NBA teams’ annual media guides. Results for this study were estimated using the Cox Proportional Hazard estimation. The failure variable is dismissal (non-mid-season) and the time variable is GM tenure. Our independent and control variables factored in GM structural power, playoff experiences, functional expertise, GM origin (insider vs outsider), GM reputational capital, ownership structure, GM educational background, team quality, revenue, and etc. We chose Cox Proportional Hazards models as CPH models are widely used in examining the dismissal of business executives because of their ability to simultaneously consider a number of factors impacting the probability of dismissal (Wangrow, Schepker, & Barker, 2017). In addition, CPH models can effectively handle censored data (Allison, 1984) and make no assumptions about the shape of the baseline hazard (Blossfeld et al., 2007).
Results and Conclusions
Our results support the assumption that GMs who gain power protect themselves from firing. We found that general managers having greater structural power by holding higher-level dual positions (e.g., “President of Basketball Operations”, or “Executive Vice President of Basketball Operations”) are less likely to be dismissed. Additional findings suggest that functional expertise influences the likelihood of general manager dismissal. Specifically, general managers who have worked in various positions (e.g., general manager, assistant general manager, head coach, assistant head coach, director of player personnel, and scout) and gained a wider variety of experiences are associated with a lower likelihood of dismissal. Our results also show that insider status (GMs who have worked or played for the organization) is negatively associated with the likelihood of GM dismissal and that more playoff experiences buffer GMs from firing. Finally, we observed an inverted U-shaped relationship between departing general manager tenure and post succession team performance. Specifically, we found that the inflection point (extreme point) is 9.16, suggesting that post succession performance increases as departing GM tenure increases up to around year nine and post succession performance decreases as departing GM tenure exceeds year nine. In line with previous studies (e.g., Vancil, 1987; Shen & Cannella, 2002), this study suggests that ownership needs to carefully handle executive tenure.
The empirical findings from this study extend the understanding of how organizational structure and power relations can influence tenure and decision making within professional sport franchises. Through understanding GMs, researchers could also gain further insights about the power dynamics between head-coaches and general managers, the relationship between coaching turnover and team performance, and potentially adding to existing literature on coaching turnover. In addition, as backfilling costs employers roughly 20% of that position’s salary in hiring, recruiting, and onboarding costs, the findings from this line of research also could potentially help improve the efficiency of human resources and financial management in sport. Specifically, future researchers could look at the factors that are important in determining the fit between a general manager and an organization, and as such, reduce the costs that come with the high rate of dismissals and rehiring of executives that exist in the NBA.
Are leaders leading others to perform better? Empirical analysis of effects of leader players’ performance on other players in NBA
- Alperen Kocsoy, Durham University, alperen.kocsoy@durham.ac.uk
Introduction and Motivation
It is believed that performance of an employee or a manager affects the performance of other employees, especially when one employee is seen as a leader, not only in businesses but also in sports teams. When sports teams acquire star players, coaches, fans and sports commentators often claim newcomers will improve the performance of teams not only by performing well but also improving performances of other players in teams in several ways such as by improving their tactical knowledge, being a source of spillover effects (e.g. player producing more assists presents others with an opportunity to score more points) or reigniting others to spend more effort thanks to their charisma. This is called the ‘LeBron Effect’ among sport commentators stemming from LeBron James who helps his teams to reach finals or championships while performances of his former teams and teammates are sharply decreasing after him.
The primary aim of this paper is to increase our understanding of whether performance of leader players affect performance of other players in NBA teams or not. NBA is quite useful for the analysis because of several reasons. Firstly, NBA provides us with games played in four quarters which allow us to control performance of players during different periods of games. For example, how performance of a player changes when his leader leaves games after the first, second or third quarter can be estimated. Secondly, basketball games are played with 5 players which can be an optimum number to lead and makes every single player and leader significant in games. In other words, basketball requires players to do their best and prevents them to shirk or spend time to rest while they are on courts. For example, in sports with more players such as football, a defender may get rest while his team attacks. However, in basketball, whole team should be agile, dynamically play, and put maximum effort all the time to succeed in NBA. Lastly, as game scores change too quicker (in seconds) than many sports in basketball, every action of players are more valuable including ones we cannot have in-game and player statistics such as diving for a ball or some actions unrelated to ball or game but could motivate and reignite fans and other players.
Data and Methods
Data come from three main sources. First, I collected player-match statistics per quarter from the official website of the NBA. Secondly, additional player statistics such as GameScore (GmSc) and plus-minus (+/-) are collected from basketball-reference, a widely used and reliable data provider for basketball. Lastly, the player salaries are collected from ESPN, U.S. based sport broadcasting platform. There are 646,427 player-match observations that cover all seasons between 1996-97 and 2020-2021.
GameScore is a metric to evaluate players’ productivity using their all tangible performance statistics such as points, rebounds, personal fouls and turnovers.
On the other hand, plus-minus (+/-) is a box score-based metric which estimates the contribution of a player to his team when he is on the court, and it is determined by calculating the difference in score of the game when the player enters the game and leaves the game. Therefore, the player gets a score as the differences between points scored by his team and opponent only when he is on the court regardless of which player scored points. For example, when James was on the court, the Lakers scored 74 and conceded 69. In this case, plus-minus of James becomes 74-69=5.
Moreover, I created another metric, intangible score, by using GameScore and plus-minus to detect the intangible performance of players. As plus-minus is a metric of performance of a player regardless of personal statistics such as assists or fouls, it is determined by all effects of a player on his team. However, GameScore is a metric that calculates only tangible actions of the player. Therefore, the difference between plus-minus and GameScore gives us the intangible performance of the player. It was inspired by Solow residuals which is the part of the growth that cannot be explained by the growth of labour and capital. However, I did not use Solow’s methodology as it could not be very useful with data from NBA. Here, I aim to calculate performances of players which cannot be explained by player statistics (which explains only 30% of whole performance) as we think some actions of players which are not related to games directly may motivate and reignite their teammates.
Then I defined leadership categories which are:
- Team captains: Captains are selected by team managers or coaches and accepted as leaders of teams.
- Most-paid players: Most paid players are generally the most talented players or superstars. I believe they may have effects to ignite on other members of the team.
- Most-tenured player: This is the player who spends more years on the team than others. Such players may feel they belong to the team and help others for the success of the team. Players playing for the same team for more than 10 years are accepted as the most-tenured player because of two reasons. First, to prevent many players to become the most-tenured player in the team and secondly, it is believed that just a few years are not sufficient to feel belonging to the team.
- Coached in future: It is believed that coaching is mainly about leading and convincing people with their charisma or coaching skills. A player may have such skills which can motivate and ignite his teammates while playing if he would have coached in future. They may not need to be the coach of teams to influence other members of teams.
- All-star players: Every season, the most talented players of the NBA are chosen and play a special game called all-star. Players who played in all-star games already prove their talent to other players in teams. Therefore, being an all-star may be a sign to be the talent leader of the team and helps to garner teammates’ admiration. Then, the all-star player can be accepted as the leader of the team by others.
- Intangible performance leader: This is the player in each team who scores the highest intangible score during that season. Their actions on the pitch which could not be seen in player statistics may also motivate or ignite others.
I start the analysis with an auxiliary hypothesis that expects leader players to perform better than non-leaders. It is believed that leaders should do better than others to be able to lead. Then, the performance of the leader on the performance of other players is controlled. Afterwards, I checked how the minutes played by the leader effect the performance of the non-leaders. Furthermore, I examine how the absence of a leader affect other players in the whole game, after the first, second or third quarter of games.
Results
The preliminary analysis shows that leader players are performing better than non-leaders as expected in the auxiliary hypothesis. Also, the performance of all-stars, intangible score leaders and players who coached in future have a significant positive effect on the performance of other players. Increased playing time of leaders causes other players to perform worse per minute. That means, when leaders play and take more responsibility, non-leaders have more chances to get rest or shirk. Lastly, in absence of a leader, non-leaders do not perform better but they start playing just like their leaders. For example, leaders produce points and assists more and commit fewer fouls than non-leaders per minute in general. In absence of leaders, non-leaders score and assist more while committing fewer fouls per minute they play to compensate for the absence of their leader in games.
Heterogeneity of motivations among football club crowdinvestors
- Szczepan Kosciolek, Jagiellonian University in Krakow, Poland, szczepan.kosciolek@uj.edu.pl
Purpose of the paper
Considering the financial instability of win-maximization-oriented European football clubs and their interest in going public (Prigge & Tegtmeier, 2019), the growing amount of research on the behaviors of football club investors should not be surprising (see for instance, the review section in Weimar & Fox, 2021). This trend also includes investment motivations in equity crowdfunding, as fundraising campaigns have been shown to be attractive for emotionally driven nonprofessional investors who are fans of the clubs they invest in (Kościółek, 2022). However, while maintaining the level of aggregated data for the entire population, knowledge about the investment behavior patterns of this group is still very superficial.
Therefore, the aim of this study is to segment the crowdinvestors of football clubs through the use of investment motivations. Adopting a market segmentation strategy leads to answering the research question of whether the motivations of football club crowdinvestors are homogeneous in terms of how they are prioritized.
Theoretical description
This study is based on self-determination theory (SDT) and provides an important opportunity to advance our understanding of the motivations of crowdfunding campaign participants (Ryan & Deci, 2000). According to SDT, actors undertake specific activities because they are motivated to do them intrinsically, based on an internal desire to act to meet their needs, or externally, when the reason for the action is a reward, a punishment, or another external factor. One activity may be accompanied by many specific motivations, but what is important is that each of them fits into this framework. This also applies to crowdfunding participants.
To date, empirical research on motivations in the crowdfunding market fulfils SDT, but no consensus has been reached among researchers concerning the dominance of intrinsic or extrinsic motivations when it comes to participation in equity crowdfunding campaigns (e.g. Bretschneider & Leimeister, 2017; Lukkarinen, Wallenius, & Seppälä, 2018). The solution to these doubts may be to focus research on projects in specific thematic areas and to investigate the extent to which motivations differ among crowdinvestors. In the case of football clubs (Kościółek, 2022), crowdinvestors have been found to be mainly intrinsically motivated, but investigations of their internal variance are lacking. This paper aims to fill that gap.
Material and method
The instrumental solution to test the homogeneity of investors is market segmentation, which is the process of dividing the heterogeneous mass market into a homogeneous group of customers. The two-step a priori motivation-based segmentation that is applied in this study is considered the most impactful approach because it leads to determining who invests in football clubs through equity crowdfunding and why they choose to do so, as well as providing profiles of given market segments (Dolnicar, 2003). In the context of this study, the key point is that this approach leads to the assessment of motivation heterogeneity among crowdinvestors.
Survey research (n = 793) was utilized as the method in this study through the application of the motivation scale for crowdinvestment (Kościółek, 2022). The questionnaires were distributed electronically among the crowdinvestors of Wisla Krakow S.A. with the assistance of the club’s marketing managers.
Data analysis consisted of three stages. First, confirmation factor analysis (CFA) was applied to assess the validation of the motivation scale. Second, a cluster analysis was applied to classify crowdinvestors into segments. The hierarchical Ward method with Euclidean distance was calculated to assess the optimal number of segments, and, afterwards, the nonparametric k-means method was applied to classify the observations into clusters. Third, cluster profiling was carried out. Quantitative variables, specifically those related to consumption, were tested using both the Kruskal-Wallis and Dunn tests. Qualitative variables, specifically sociodemographic characteristics, were analyzed with chi-square tests and, if segments differed significantly, Cramer’s V tests to determine the extent of their variation.
Main results
This study aimed to segment football club crowdinvestors with the use of investment motivations. The cluster analysis produced three market segments of crowdinvestors, which can be described as follows: (i) benefit-oriented (50.7%) – investors with a high level of emotional connection with the club who care about the goal of the campaign, but are also motivated by external benefits in the form of prizes and acquiring the status of co-owner of the club; (ii) club-oriented (45.3%) – investors for whom the leading motivation is their emotional connection with the club and the desire to achieve the goal, with other motivations being secondary; and (iii) goal-oriented (4.0%) – investors who do not expect external benefits and have little emotional connection to the club, but hope to achieve the goal for which the campaign is being run.
Contribution and implications
The findings suggest the dominant role of intrinsic motivations among football club crowdinvestors: emotional involvement with a club, support for the cause of a campaign, and acquisition of the status of a football club owner. These findings support evidence from previous work in the field of sports crowdfunding (Huth, 2018; Kościółek, 2022). Overall, the results of this research shed new light on what we know about the behaviors of crowdinvestors by showing that the mix of motivations is quite heterogeneous, even if the scope of the analysis is limited to the homogeneous campaign creator group of football clubs.
The adopted two-step motivation-based segmentation is a product-specific procedure based on latent variables and is considered the most impactful way to segment the market (Dolnicar, 2003). Therefore, we can confidently recommend this method to deliver the appropriate value proposition for each market segment.
Gender Differences in Peer Effects – Evidence from Speed Skating
- Mario Lackner, Johannes Kepler University Linz, mario.lackner@jku.at
Introduction
Peer effects are of high interest when investigating performance of women and men in different levels of education (Lavy and Schlosser, 2011). Other research investigates peer effects in team- (Ashworth and Heyndels, 2007; Depken and Haglund, 2011; Molodchik et al. 2021) and individual sports (Guryan et al. 2009; Jane, 2015). However, measuring size and direction of peer effects is methodologically challenging. The majority of previous studies relies on quasi-random gender compositions of relevant peer groups for causal identification of peer effects. Feld and Zölitz (2017) argue that empirical estimates of peer effects are affected by many social and statistical forces that simultaneously affect both peers. This leads to a wide array of estimates, differing in magnitude and direction (Sacerdote, 2011).
I propose an innovative way of estimating the direction and extent of peer effects among female and male competitors. By design, certain competitions in speed ice skating involve a clear information advantage for one contestant. This allows a reaction of the contestant with the advantage, while ruling out a significant peer effect in the opposite direction.
Institutional setting, data, and empirical approach
Long-distance speed skating is a winter sport with a long Olympic tradition, whose roots can be found in Northern Europe for more than a century. In 1924, multiple competition formats were introduced to the Olympic Games, including the 1500 meters race for men. In 1960, women’s competitions followed. These formats were appended several times, and at the 2022 Olympics both genders were competing in 7 competition formats.
I will be focusing on the 1500 meter format, a competition format with 3 full laps of 400 meters, preceded by a shortened lap of 300 meters. This format has the key feature that two contestants share the track, with one competitor starting on the inside lane, while the other one has the outside lane. The racer starting inside, however, is positioned about 12.5 meters behind. Consequently, the racer on the inside lane has the distinct advantage to observe directly how his/her competitor paces the first lap of 300 meters. This advantage will be equalized after round 1 by the fact that the racer on the inner lane will have a distance advantage due to the slightly shorter radius (and this distance) of her/his lane.
I will exploit the specific feature of the 1.5k races and measure the peer effects resulting from differences in starting positions. I collect data from all women’s and men’s 1.5k competitions since 2003, as provided by the ISU (All data are available at https://live.isuresults.eu/events/.). In total, I collected information on 484 individual competitions, including ISU World Cup races, World Championships, and Olympic Games. Data provide detailed information on performances on the level of the individual lap, starting orders including information about lane assignment, and basic information on competitors. To quantify the peer effect for female and male skaters, I estimate the following model:
Y_(i,p,c)=α0+β_1 peer〖effect〗(i,p)+ξX’+τc+π_i+ϵ(i,p,c)
where Yi,p,c measures performance of skater-season i, competing in pair p at competition c. β1 measure the effect of the direct competitor’s lap time in the first lap. X is a vector of competition-level controls. To control for competition specifics, I estimate competition fixed-effects τc. To control for variation in ability, I estimate skater-season fixed effects πi.
Preliminary results
First preliminary results are presented in Table 1 below. I estimate a significant effect of the peer’s performance during lap 1 on the average lap performance during laps 2-4 for female skaters who compete at the inside lane. For male skaters, however, I do not estimate a significant effect. Focusing finishing times, I estimate that first-lap peer effects do translate into final performances: a deterioration of the peer’s lap-1 time of 1 sec. increases the observed peer’s finishing time by about 0.16 seconds. While this effect seems small, it is likely economically significant, as the average gap between two final ranks is about 0.4 seconds. Thus, women reacting to a peer who starts slower by one second will result in a half rank deterioration in the final classification. Figure 1 below illustrates the results from a specification using quintile dummies of the peer effect (3rd quintile as the reference category). The results show that female skaters slow down if the peer skater on the outside lane is slower than the third quintile. This suggests that I measure a negative (slowing down) peer effect rather than a positive one. Again, no effect for make skaters is estimated.
Discussion and conclusion
My empirical approach enables the precise measurement of peer effects for competitors of both genders. I estimate a significant peer effect for female competitors, not for male skaters. The female peer effect translates beyond short-term outcomes and affects final performances and rankings. This results confirm earlier findings that suggest that only women do react to peer effects (e.g. Brune et al., 2020), while contrasting other findings that mainly see men susceptible (Beugnot, 2019). Due to unique design of the contests under investigation, I can largely rule out a reverse effect which would bias my estimates.
The estimated peer effect is most likely based on strategic decisions rather than differences in ability: the opposing skater on the outside line can have a different strategy. She/he can either decide to start slow and preserve energy for later rounds, or she/he can start fast and make an attempt to preserve and early advantage for the late phase of the race. This will affect their peer on the inner lane. Female skaters might adapt their strategy to the opponent starting in front of them, while male competitors stick to their earlier plan.
Table 1. Estimated peer effects for female and male skaters
Figure 1. Non-linear peer effects
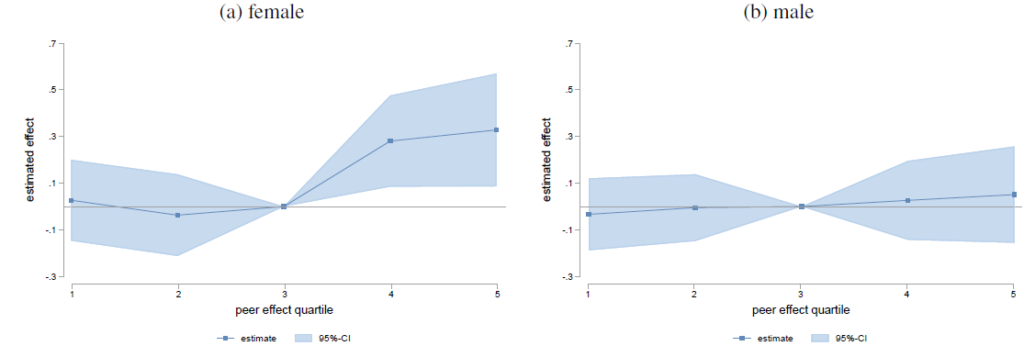
Mass Sport Tourism Event Participants’ Willingness-to-Pay for Offsetting Greenhouse Gas Emissions – Case of World Winter Masters Games 2020
- Petri Lintumäki, University of Innsbruck, petri.lintumaeki@uibk.ac.at
- Diana Alexe, University of Innsbruck
- Hannes Winner, University of Salzburg
- Martin Schnitzer, University of Innsbruck
Background and Motivation of the study
The Winter World Masters Games (WWMG) is an international multi-sport event for 30+-year-old athletes. As there are no competitive qualification requirements for participating athletes, the event can be considered as a sport tourism event rather than a competitive sports event. In January 2020, the WWMG was staged in the city of Innsbruck, in Austrian region of Tyrol. The event welcomed over 3,000 athletes from 56 different countries to compete in 12 winter sport disciplines.
Climate change is the most pressing concern the humanity is currently facing. Scientific community has recently warned on the gravity and urgency of the climate crisis, and called out action from governments, businesses, and the rest of the society to mitigate the greenhouse gas emissions and adapt to the situation by protecting the natural ecosystems (Ripple et al. 2019). Simultaneously, there is growing body of research that confirms the substantial environmental impacts of sports tourism, including passive and active sports tourism, as well as sports events (Shahbaz et al. 2021). These findings highlight the need and responsibility of tourism and event industries to address their irrefutable impacts on climate and environment, and to develop ways to mitigate them.
The aim of this study is to determine the participants’ willingness-to-pay (WTP) for compensating the greenhouse gas emissions of participation at the WWMG 2020. Furthermore, in order to help event organizers to implement climate policies in an effective way, this study researches the connection between the characteristics and background of the respondents and their WTP. To our knowledge, this research is the first one addressing environmental impact management of 1) a large-scale participatory sports event and 2) participatory winter sport event, the latter being interesting and actual considering the threats global warming is posing particularly on the practice of winter sport.
Theoretical Background and Literature Review
The environmental impacts of spectator sports events (e.g. Jones 2008; Collins et al. 2012; Cooper and McCullough 2021) and sports tourism (Wicker 2018, 2019), on one hand, and environmental awareness and attitudes of active sports participants (Hanna et al. 2019; Brymer et al. 2009), on the other hand, are receiving increasing research interest. Extant literature clearly acknowledges that sports events and active sports tourism have heavy impacts on environment and climate, but also observes positive attitudes towards environmental conservation efforts among sport (particularly outdoor sport) tourists. There is, however, relatively little research on environmental impact compensation strategies of sports events in general and participants’ WTP for impact compensation in participatory sports events in particular.
Methodology and Preliminary Results
The data for this study was collected through an online survey sent to the athletes participating at the WWMG 2020 right after the event had taken place. The survey questions implemented for this study were annexed to a larger survey designed also for the economic impact analysis and participant satisfaction study of the event. Questions related to demographic characteristics such as age, gender, nationality, country of residence, income etc. were asked in the first part of the survey, which was followed by survey for economic impact and participant satisfaction surveys. The final part of the survey was dedicated to this study. The online survey questionnaire was created with “soscisurvey.de” and was available to the participants for two weeks. After the first week, the participants were also sent a reminder to complete the survey. The survey was available both in English and in German.
Empirically, we use contingent valuation method (CVM) to determine the participants willingness to pay for offsetting their own contribution to the greenhouse gas (GHG) emissions of the WWMG 2020. The CVM is a “stated preference” method, and involves directly asking consumers of a non-market good (in this case the “right” for the individual CHG emission) about its value (Cameron 1992) by advising them to state the lower (i.e. how much the respondent would be definitely willing to pay for offset) and upper payment bound (i.e. the amount from which the respondent would definitely be no longer willing to pay). Moreover, we use probit regressions to estimate (i) the probability of participating in the environmental part of the survey and, based on this, (ii) the probability of a positive willingness to pay (WTP). Of all 1278 survey respondents, 566 answered the environmental part of the survey (44.3 percent). The probability of participating was influenced by the education (i.e., higher-educated people were more willing to participate) and the language-background of the respondents (i.e., German speaking ones were more willing to participate). Furthermore, 309 out of the 566 respondents who participated in the environmental part of the survey indicated a positive WTP (54.6 percent). With regard to WTP, respondents were asked how much they would be willing to pay as a participant in the WWMG for a reduction of greenhouse gases and thus an improvement in climate change. By observing the self-selection bias and assuming non-respondents as not willing to pay, our preliminary analyses allow us to estimate the average WTP for greenhouse gas offsetting among all event participants to be between 7 and 13 euros / participant. For these payments, we found that the general attitude towards the environment was crucial: In particular, the more the environmental problem was perceived as urgent, and the more the event itself was perceived as environmentally friendly, the more likely people were willing to pay.
Final results of this study will be available in May 2022.
Does Television Coverage Impact Live Attendance? The Case of College Football
- Jeremy M. Losak, Syracuse University, David B. Falk College of Sport and Human Dynamics, jmlosak@syr.edu
- Samuel V. Marteka, Syracuse University, David B. Falk College of Sport and Human Dynamics
- Mackenzie Mangos, Syracuse University, David B. Falk College of Sport and Human Dynamics
Extended Abstract
Television coverage (and by extension, streaming coverage), has significantly altered the financial landscape of sport across the world. Even during the COVID-19 pandemic, without having fans in the stands, it was still financially plausible to play games, a reality that would not have been possible two decades ago. Broadcast dollars are currently at their greatest levels for almost every major sports league around the world.
Of interest is the potential disruption evolving broadcast coverage has on more traditional revenue streams, including in-stadium sources. While the net effects on revenues are certainly positive, could there be potential negative consequences to other revenue sources because of increased television coverage? This paper considers the impact broadcast coverage has on live single-game college football attendance. Despite rising total revenues, average stadium utilization rates have steadily declined across Football Bowl Subdivision (FBS) schools since 2008. The aim of this study is to analyze the role television coverage may play in this downward trend.
Theoretical Background
The literature surrounding demand for in-person sporting events is extensive (see overviews in Borland and MacDonald, 2003; Coates et al., 2004; Ge et al., 2020; among many others). Specifically related to college football, a number of papers consider factors of demand that impact the decision to attend a live football game (see Tainsky and McEvoy, 2012; Brown and Salaga, 2018; Falls and Natke, 2014; among others). This paper adds to the general attendance demand literature by considering a specific factor of demand: television coverage.
The effects of television coverage on attendance are still unsettled in the literature. On one hand, conventional wisdom may suspect that television acts as a substitute good for in-person attendance. Attending a game requires significant costs (both monetary and nonmonetary), while the at-home experience only continues to improve with technological advances. On the other hand, television can also function as a complement. Nationally broadcasted games typically receive additional advertising, which may also serve to create a “prestige” factor in attending the game in person (anyone can watch at home, but only a select few can attend in person).
Perceptions related to the impact of live broadcasts on attendance have shifted over time. Papers by Baimbridge et al. (1996), Allan and Roy (2008), Garcia and Rodriguez (2002), Forrest and Simmons (2006), Buraimo and Simmons (2009), and Solberg and Mehus (2014) show declines in attendance when matches are broadcasted on television for different soccer leagues and levels across Europe. More recent papers by Kringstad et al. (2018), Falls and Natke (2014), and Losak et al. (forthcoming) tell a different story. Kringstad et al. (2018) differs from Solberg and Mehus (2014) by identifying a complementary effect of broadcasting on stadium attendance for Norwegian football matches between 2005 and 2011. Falls and Natke (2014) utilize an unbalanced panel of 4,317 football games played at the home stadiums of FBS football teams and show that attendance increases with video coverage. Losak et al. (forthcoming) utilize a longer panel data set of college football games and focus specifically on the impact of new conference networks on aggregate season attendance for college football teams. They reject the conclusion that television coverage and conference networks are to blame for the decline in college football attendance, showing instead a complementary effect. This paper uses a similar data set as Losak et al. (forthcoming), but focuses on game-level attendance instead of aggregate season attendance (similar to Falls and Natke, 2014), and emphasizes the quality of the broadcast as indicated by the type of network the game appears on.
Methods and Findings
Early results support the conclusions of Falls and Nate (2014) and Losak et al. (forthcoming). Appearing on television is associated with an increase in game day attendance. This effect is greatest for games on broadcast networks (CBS, NBC, FOX, and ABC), followed by basic tier networks (ESPN, Fox Sports 1, NBC Sports, etc.), premium networks (conference networks, ESPNU, etc.), regional networks, and streaming only. This result fits the prestige and advertising narrative well, with games appearing on the networks in the most homes (broadcast networks) garnering the greatest complementary effect.
To identify these effects, this paper incorporates a number of empirical tools. Preliminary results are derived from panel data fixed effect linear models. Censored (at capacity, or 100% stadium utilization) approaches are also considered, in addition to other base specifications that control for factors of demand that are typically present in the literature (game quality, travel costs, team and opponent quality, stadium effects, economic variables, etc.). We also focus extensively on the potential selection bias associated with being on television. Premium matchups are games that are likely to appear on television and are also likely to generate large crowds. We incorporate techniques that allow us to isolate the effect of television on attendance without the confounding effect of team and matchup quality.
Our data set covers all home games played at FBS schools between 2003 and 2019, with the sample ending right before the beginning of the COVID-19 pandemic. Television data comes from a variety of sources, including ESPN box scores, school media guides, and other online sources. Attendance data comes from ESPN box scores and school media guides and websites. This extended panel allows us to consider the changing effects of television over time, which is especially prevalent given the massive growth in broadcasting of college football games (over 37% of games in our sample were not broadcasted in 2003, compared to just over 1% of games not being broadcasted in 2019). Given the shift in thinking that has taken place in the literature, it is interesting to see how these effects in college football have changed over the 17-year sample.
Rival league formation in the early decades of English football
- Patrick Massey, Compecon – Competition Economics
- James Reade, University of Reading
Cairns, Jennett, and Sloane (1986) note a debate in the sports economics literature as to whether rival leagues represented a stable long-run equilibrium. Che and Humphreys (2015) analyse the formation of rival leagues and deterrence by incumbent leagues in professional team sports, which they describe as one of the least studied forms of competition in sports. They cite several examples of rival league formation in all major US sports prior to the 1980s. Their model indicates that, if the incumbent’s bargaining power is sufficiently high, its equilibrium strategy is to allow a rival league to form and then merge with it, otherwise, the incumbent should expand into otherwise-viable cities with no teams. Their model also suggests incumbent leagues may pay high player salaries to deter rival league formation.
Our paper seeks to add to the limited literature on rival sports leagues by considering rival league formation in the early decades of English football. We construct a measure of relative league strength based on teams’ ELO ratings. We then use this measures to empirically test whether rival league formation in the early decades of English professional football can be explained by the Che and Humphreys (2015) model.
The Football Association (FA) was formed in 1863 with the objective of drawing up a uniform set of rules for football. However, agreement proved impossible, and two football codes emerged: Association Football (or soccer) and Rugby Football, although initially both had quite similar rules. “[C]arrying the ball was outlawed and [association] football and rugby went their separate ways” Wilson, (2009).
Initially rugby became increasingly popular in the industrial North of England, but it fell behind soccer in terms of popularity following the decision of the Rugby Football Union (RFU) to prohibit professionalism (Collins, 2015). The ban on professionalism resulted in the majority of rugby clubs in the North of England forming a separate Northern Rugby Football Union (NRFU).
The Football League was established in 1888. Contrary to Che and Humphrey’s (2015) claim that rival league formation had never occurred in European football, there were three attempts to form rival leagues. The Combination League, which was also launched in 1888, involved a number of unsuccessful Football League applicants. Poor management and a lack of organisation meant it failed to complete its first season (Whittle, 2020). Several Combination League members were involved in a second rival league, The Football Alliance, which ran for three seasons from 1889/90 before merging with the Football League (Taylor, 2005). A more durable rival was the Southern League, formed in 1894/95, and which persisted as a serious rival to the Football League until its top tier teams were absorbed by the latter in 1920/21 (Edwards,1993). The Football Alliance, like the Football League, drew its membership from the Midlands and North of England, whereas, as its name suggests, the Southern League originated in the South of England, an area which was largely ignored by the Football League. “By the late 1890s, Southern League club were beginning to seriously rival their Football League compatriots on the field” (Taylor, 2005, p.11). The Football and Southern Leagues played regular representative matches between each other and against the Irish and Scottish Leagues. From 1907/08 to 1912/13, the FA Charity Shield was contested between the Football League and Southern League Champions. The Southern League represented a further threat because it did not recognise the Football League retain and transfer system until 1910, which meant that players were free to switch from Football League to Southern League clubs without any transfer fee being paid.
RFU opposition to any form of league competition, on the grounds that the establishment of a league would inevitably lead to professionalism, removed another potential source of rival league formation. The NRFU introduced a number of rule changes in its early years in response to the growing challenge from soccer (Read et al., 2021). The Football League adopted an “aggressive strategy” of recruiting clubs in NRFU strongholds in the 1900s (Williams, 1994). We observe a similar strategy by the Football league of recruiting teams from both the Football Alliance and the Southern League.
We construct a measure of the strength of rival leagues within a sport, using the mean, maximum and minimum Elo ratings of teams in the leagues, and we consider the variation in these measures as applied to the Football League and Southern League between 1888 and 1920. We use this to illustrate a timeline of events during the near 30-year period of co-existence of these two leagues. We show that the Southern League’s mean strength of team was consistently higher than that of the Football League Division Two, and while the mean strength remained always below the First Division, for a spell in the early 1900s, the best Southern League team was better than the best Football League team. This is shown in Figure 1.
Figure 1 Mean, maximum and minimum Elo Ratings by Division per year, 1888-1920
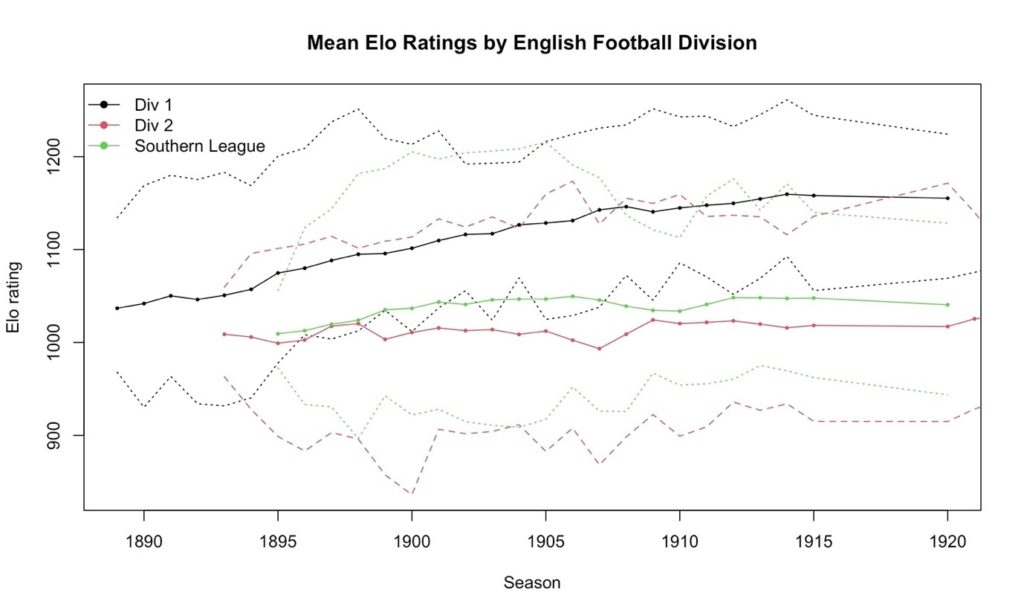
There were regular discussions regarding a merger between the Football League and Southern League throughout the existence of the latter, with a concrete proposal in 1909 failing, before in 1920 the Southern League’s absorption into the Football League on arguably inferior terms. In the twenty years to that point, the Football League had poached a number of Southern League clubs, in some ways replicating its response to the NRFU. At the same time, it is clear from Figure 1 that the Southern League fell behind Football League Division One in quality, to the extent that the Football League was better able to dictate terms, which is consistent with Che and Humphreys (2015). In our work we document these variations both quantitatively and qualitatively.
Fewer teams, more games, larger attendance? Evidence from the structural change in basketball’s EuroLeague
- Alessandro Di Mattia, Faculty of Business Administration and Social Sciences at Molde University College
- Alex Krumer, Faculty of Business Administration and Social Sciences at Molde University College, alex.krumer@himolde.no
Extended Abstract
In April 2021, during the COVID-19 pandemic, the headlines of Europe’s leading newspapers were all about the earthquake in European football – the establishment of the Super League (See https://www.theguardian.com/football/2021/apr/20/shameful-how-the-papers-covered-european-super-league-backlash. Last accessed on 29/09/2021.). The idea was to create a new, closed league with about 20 top teams. The promoters of the idea justified it by the increased number of games between high-quality teams, which would have a secured spot in the tournament for many years. This contrasted to the UEFA Champions League that consists of 32 teams where the entry is based on the results in the domestic leagues. Similarly, FIFA (the international governing body of association football) recently decided to test the idea of having the World Cup every two years instead of every four years. FIFA authorities provide a similar justification, arguing that fans would like it because of the increased number of games between high-quality teams over a shorter period of time.
In this paper, we investigate whether an increased frequency of games between high-quality teams would indeed increase attendance demand. For that, we take advantage of a recent change that occurred in the basketball EuroLeague, which is the most prestigious tournament among European teams. More specifically, in the 2016–17 season, the EuroLeague reduced the number of participating teams from 24 to 16 and increased the number of each team’s games in its round-robin tournament by 25 percent (Before the change, a regular season consisted of six teams in a group, such that each team played 10 games. The top four teams advanced for the Top 16 stage, where each group consisted of eight teams, such that each team played 14 games. The top four advanced for the quarterfinal stage. After the change, there was one long round-robin tournament between 16 teams (also called a regular season), such that each team played 30 games. The top eight advanced for the quarterfinal stage.) . The EuroLeague authorities used a similar justification as in football: fans would prefer a tournament with a reduced number of teams of higher quality, which would play a larger number of games.
In our empirical analyses we used data from the three seasons before and three seasons after the change. Comparing the attendance of the same teams that played before and after the change, our fixed effects estimation reveals a significant decrease of close to 10 percent in attendance per game after the change compared to the stage of top 16 that was used before the change. Furthermore, we found no significant difference in attendance between the regular seasons before and after the change. We also found no difference in attendance before and after the change in the quarterfinal stage, the format of which remained constant over the years. Finally, we found that the main reduction in attendance after the change appeared in the first half of the season, where the games are likely to be perceived as less decisive than the second half of the season. This suggests that an organizer of the tournament should not only aim to increase the quality of the teams, but also care about an attractive tournament design.
Our results regarding the decrease in attendance in the European basketball can be explained by the seminal theory on time allocation that was proposed by Mincer (1962) and Becker (1965). While Mincer (1962) considered a married woman’s time to be a trade-off between housework and paid work, Becker (1965) emphasized the idea that there are many different types of time use that combine into a single objective function, with a single overall budget constraint. Later, these ideas on the importance of time allocation were used in the context of the demand to sport and leisure (e.g., Downward & Rasciute, 2010; Hallmann et al., 2017; Løyland & Ringstad, 2009).
Finally, our paper also relates to the growing literature on attendance demand, which mainly concentrates on traditionally major football leagues (e.g. Buraimo & Simmons, 2015; Krumer & Lechner, 2018; etc.), and the North American sports leagues (Jane, 2016; Lemke & Tlhokwane, 2010; just to mention a few). Despite many studies on attendance demand, a recent comprehensive review by Schreyer and Ansari (2021) noted a notable absence of research on minor leagues as well as on minor sports. Only a handful of papers have investigated attendance demand in minor football leagues (e.g., Buraimo, Tena & de la Piedra, 2018; Pawlowski & Nalbantis, 2015) and less popular sports such as handball (Storm, Nielsen & Jakobsen, 2018), ice hockey, and basketball (Wallrafen et al., 2021). To the best of our knowledge, no previous study has been conducted on attendance demand in basketball’s EuroLeague. This is surprising given that, according to Wikipedia, “the EuroLeague’s attendance is the fifth-highest of any professional indoor sports league in the world (the highest outside the United States), and the second-highest of any professional basketball league in the world, only behind the National Basketball Association (NBA).” Thus, we fill this gap by investigating attendance demand in the EuroLeague before and after the structural change in the 2016–17 season.
Factors Affecting Willingness to Buy Among Sports Fans
- Adam Metelski, Poznań University of Economics and Business, adam.metelski@ue.poznan.pl
- Marcin Leszczyński, Poznań University of Economics and Business
- Michał Litwiński, Poznań University of Economics and Business
Motivation and purpose of the paper
The results of previous studies indicate that the way people obtain information and consume sports products is changing as a result of technology development (da Silva & Las Casas, 2017). The fan interaction provided by new technologies results in a reduced importance of traditional channels such as television and a smaller role for traditional journalists. Many sports fans are no longer interested in the game alone – they crave the kind of exclusive and shareable experiences that can be amplified by technology. New technologies can also increase fan engagement by tailoring experiences to individual fan preferences (Deloitte, 2018). It should be also noted that the COVID-19 pandemic has hit the sports world particularly hard. The pandemic had the greatest impact on direct matchday revenue, as stadiums were closed to fans or could be only partially filled. All that described above caused that new business models have started to develop in sport, i.e. clubs and organizations are trying to obtain new sources of income through, for example, OTT platforms or the transmission of sports events in the Pay Per View format. The aim of the study is to determine the factors that affect the willingness to buy of sports fans.
Literature review
In sports marketing, fans are treated as a diverse group whose representatives can be found in every socio-economic class (Vale & Fernandes, 2018). It is also necessary to mention that there is a new group of sports fans – modern fans who have been functioning in the digital world since birth, and therefore have their specific behavioral patterns, habits, and expectations (Złotnicki & Złotnicki, 2019). Younger generations are characterized by a different model of consumption of sports products which is based on the use of digitized channels of searching and consuming content. Processes in the area of interaction with fans include, among others: minimizing the boundaries between the event watched online and offline, increasing the digital presence of sport, and developing opportunities for interaction with stakeholders through websites, mobile applications, and social media (Xiao et al., 2018). What is more, members of Generation Z are half as likely as Millennials to watch live sports regularly and twice as likely to never watch it (Silverman, 2020). Another interesting fact is that about half of young (18–34 years old) NFL, NBA and MLB fans prefer watching highlights over a full game as opposed to fans aged 35 and more who still like to tune in for the whole event (Bridge, 2021). All this means that sports organizations will have to adapt to changes taking place on the market, and one of the solutions is to introduce some personalized paid content, and therefore it is important to determine what factors affect the willingness to buy of sports fans.
Main results
The study was conducted in the form of an online survey in 2021 among Polish volleyball fans. It is worth adding that in Poland volleyball is one of the most popular sports, and the national team is one of the best in the world (WorldofVolley, 2020). Overall 581 people participated in the study. Among the respondents, 61.1% were women, 38.2% were men, and 7 people did not want to answer this question. The respondents in the survey answered the same questions, but at the end they were randomly divided into three groups, the first of which watched a 2-minute film from the backstage of the match, the second a 2-minute film from the after-match life, and the third group read a description of such materials. The aim was to get to know the opinions about this types of materials in such a way that only one material was viewed by one person. The estimated models were based on primary data collected by survey. We recoded data appropriately in order to obtain dependent (willingness to buy) and independent (sex, age, assessment of income situation, engagement in team’s life, information seeking, number of watched matches, type of material, material attractiveness, willing to watch, preferred material) variables.
Inference about the effect of independent variables (the whole set and separate groups of them – 5 models) on willingness to buy was based on the multinomial ordered logit model. This decision follows from the character of the dependent variable (ordinal variable). Robust standard errors were used to reduce the negative effects of heteroskedasticity. As a part of the verification of the logit model: (1) Brant’s test of the assumption of proportional odds was carried out; (2) a joint significance test of the model with c2 distribution was applied; (3) an assessment of the amount of information that independent variables contribute to the model was made. Conclusions regarding impact of independent variables on the dependent variable were drawn on the basis of significance test for individual explanatory variables. For the ones involving dummies, an additional Wald test of joint significance was conducted. Based on the results presented in the table, models with independent variables are always characterised by a higher log-pseudolikelihood value than the corresponding models with constant only, which justifies the inclusion of the variables in the specification. Among the analysed specifications, the highest quality is noted for the one that includes all considered explanatory variables compared to specifications that take into account only particular groups of independent variables – model (1) is characterised by the highest value of log-pseudo-likelihood and the lowest value of information criteria AIC and BIC. The inclusion of all proposed groups of explanatory variables in the model is then justified.
Table 1
Based on the estimation results, it can be concluded that willingness to buy is significantly higher for older people, those with a better assessment of their income situation, those more inclined to seek information about the club, and those who rated the attractiveness of the material highly and were willing to watch it further. Importantly, there was no statistically significant relationship between willingness to buy and preference for watched material, or type of presented material (film 1/film 2/text).
Choking under pressure in online and live competitions
- Iuliia Naidenova, HSE University
- Petr Parshakov, HSE University, pparshakov@hse.ru
- Gleb Vasiliev, HSE University
Introduction
Choking under pressure is a broadly known phenomenon first introduced in Baumeister (1984) and then analyzed in numerous studies (Baumeister & Showers, 1986; Beilock & Carr, 2001; DeCaro et al., 2011; Bucciol & Castagnetti, 2020). It is defined as “performance decrements under circumstances that increase the importance of good or improved performance” (Baumeister, 1984).
Though, empirical evidence on the existence of such paradoxical behavior is scarce. Original research of Baumeister (1984) was based on experimental data. Further psychological studies also used experimental design (Beilock & Carr, 2001; DeCaro et al., 2011). However, sports provide an opportunity to investigate the problem of choking under pressure in a real-world condition.
Previous studies considered choking under pressure in various traditional sports like archery (Bucciol & Castagnetti, 2020), tennis (Cohen-Zada et al., 2017), biathlon (Harb-Wu & Krumer, 2019), football (Jordet, 2009; Mesagno et al., 2019), darts (Deutscher et al., 2018). Additionally, the interviews-based study of Hill & Shaw (2013) supported the existence of choking under pressure in team sports. However, some studies evidence contrary to the choking under pressure theory. For example, Deutscher et al. (2018) found evidence for improved performance under pressure for highly skilled individuals.
In eSports, there are various situations when professional players are under pressure. In CS:GO, a popular multiplayer first-person shooter with two opposing teams in each game, one of such situations is the so-called “clutch” – when the last member of one team fight against one or more members of opposing teams. Thus, winning the game depends entirely on the performance of one player.
This study aims at the investigation of choking in eSports assuming that the pressure increases in clutches and the effect can be different in the case of live tournaments compared to online ones.
Relevant Literature
Current understanding of the role of pressure in video gaming is scarce. Beres et al. (2021) explored the potential mechanisms of a positive and negative effects of pressure on performance and how they are related to the personal traits of players. Their results evidence that experience, reinvestment behavior, self-consciousness, obsessive passion orientation, and lower social anxiety negatively correlate with a propensity of performance decrements under pressure. However, their research is based on the survey of non-professional players.
Additionally, Leis & Lautenbach (2020) provided a systematic literature review on psychological and physiological stress in eSports in both competitive and non-competitive settings. They highlighted a lack of evidence on the impact of confounding personal traits and external conditions such as the presence of an audience on the relationship between stress and performance in eSports.
Before the COVID-2019 pandemic, most major eSports tournaments were held live, with the presence of the audience, whereas less important tournaments were held online. However, since 2020 even top tournaments must be held online as well. It gives us an opportunity to investigate the impact of playing online and live on the performance of professional eSports players under pressure. We plan to use HLTV data to explore the actual performance of the players.
Preliminary results
According to our preliminary results, pressure negatively affects player performance. However, playing the match online mitigates negative effect of pressure.
Willingness to Pay for Hosting the Tour de France
- Christian Gjersing Nielsen, University of Southern Denmark, christian.nielsen@idan.dk
- Arne Feddersen, Danish Institute for Sports Studies
Motivation and Purpose
The consensus among economists is that the economic impact of hosting sporting events is negligible at best (de Nooij & van den Berg, 2018), and hence it is argued that public investments in major sports events (and facilities) are an inefficient use of taxpayer funds (Coates & Humphreys, 2008). However, from a welfare economic perspective, it is insufficient to solely consider tangible impacts as benefits. Moreover, sporting events can be a source of utility, e.g., increased happiness, social cohesion, collective memory, identity, and prestige (Barget & Gouguet, 2007; Süssmuth et al., 2010) for the residents/taxpayers. These factors have the characteristics of a public good being non-rivalrous and non-excludable. In line with this, Streicher et al. (2017) report that people value social benefits more highly than economic benefits for hosting the Olympic Games. These non-use values can only be captured using stated preferences where individuals are asked to make choices in a hypothetical market (Carson, 2000).
Although the focus on intangible benefits of sporting events is increasing, there is still a large gap in the literature. Concrete numbers across different contexts are increasingly important to inform policymakers about different projects’ benefits (and costs) (Orlowski & Wicker, 2019). Moreover, as sporting events are typically subsidized at both the regional and national levels, it is crucial to understand how use and non-use values are related to the proximity to the event.
This project aims to elicit the willingness to pay (WTP) for hosting three stages of cycling’s hallmark event, the Tour de France, in Denmark using contingent valuation (CV). Although it is regarded as an important international event with up to 25 million TV viewers for important stages (Van Reeth, 2019), no studies have focused on the WTP for hosting it. Thus, this study will expand on the literature measuring the WTP for international sporting events in a new context. Further, it can provide public servants with valuable information about the welfare economic effects when considering bidding for future events.
Empirical Design
Using an online panel, the sample consists of approximately 1,000 respondents and is based on a questionnaire distributed in April 2022, two to three months prior to the event.
In the questionnaire, the three stages in Denmark are briefly described, including a map of the routes. After the introduction, respondents are asked a range of attitudinal questions related to their interest in sports and cycling and attitude toward the tangible and intangible benefits and costs associated with hosting large international sporting events and specifically the Tour de France assessed on a 7-point Likert scale and in free text. The purpose of the free text is mainly to make the respondents reflect on the benefits and costs they associate with hosting the Tour de France to make informed choices about their preferences and thus their WTP. Respondents are, moreover, asked about their use intentions concerning the Tour de France 2022 and specifically the Danish stages – including side events and other Tour de France-related initiatives – and their prior participation as spectators. Interest, positive attitudes toward hosting, and use intentions should all positively affect WTP. Information on these parameters is further useful to assess expectations-based validity tests. If any variables that are expected to be important are non-significant or have an unexpected (significant) sign, it diminishes the validity of the results (Bateman et al., 2002, p. 319).
Following these questions, respondents are presented with a hypothetical scenario. A serious concern potentially threatening the validity of the stated WTP amounts is if the survey is considered inconsequential – respondents should care about the (perceived) real-life consequences of policy and believe that they can influence the outcome through their answers – as the Tour de France is already scheduled to take place in Denmark in July 2022. Thus, respondents may (rightly) believe that provision is guaranteed, while they may be uncertain whether they have to pay extra in addition to what has already been paid. Thus, if this is the case, it would be in the respondent’s best interest to underbid to avoid paying extra (or to pay as little as possible). Therefore, it is essential to design a mechanism where respondents perceive provision contingent on their WTP. To deal with this, respondents are told to imagine that there is a shortfall in the budget caused by price increases due to the coronavirus pandemic and the postponement of the Danish Tour de France stages from 2021 to 2022 (due to collision with the UEFA Euro in Copenhagen in 2021, the Danish Tour de France stages were postponed one year). These causes can partly be considered exogenous and are likely to be perceived as legitimate. Respondents are hereafter told that it is necessary to impose an additional lumpsum tax on all households in 2022 to finance the additional costs to retain the stages in Denmark. We further present the survey as an advisory survey with the same incentive properties as a binding referendum (Carson et al., 2014). In this respect, respondents are informed that the involved research institutions are undertaking the survey to inform political decision-makers about the public support for inducing the tax and told that the stages scheduled to take place in Denmark will be relocated to new destinations in France if the support for the tax is insufficient. Using a double-bounded dichotomous choice format, respondents are first presented with one of five randomized amounts that their household will have to pay if the tax is introduced and asked to vote ‘yes’ or ‘no’ (or ‘do not know’). Respondents answering ‘no’ (and ‘do not know’) are then presented with a smaller bid, while respondents answering ‘yes’ are presented with a higher bid. While the double-bounded format increases the level of information of each respondent compared to the single-bounded, it is theoretically problematic as the second bid might not be perceived as independent of the first introducing anchoring and starting point bias (Bateman et al., 2002,p. 141). Still, the first bid can be analyzed independently as single-bounded.
To identify invalid bids – that is, respondents that do not reveal their true preferences and thus true WTP – respondents are asked to state the reasons for voting ‘yes’ or ‘no’. Additional debriefing questions are included in the questionnaire to test the hypothetical scenario’s credibility, appropriateness, and acceptability, and hence whether there are problems related to inconsequentiality and thus incentive compatibility.
Finally, respondents are asked a range of background questions related to their geographical affiliation and socio-economic conditions, including their income. Information on these parameters is useful to assess expectations-based validity tests, e.g., WTP should have a positive relationship to income ceteris paribus (Flores & Carson, 1997). In addition, in the case that there are significant differences between groups and the sample is unrepresentative, these parameters are important in the analytical process of extrapolating WTP from the sample to the population.
Main results
As the data collection is yet to be carried out, there are no preliminary results.
NBA Coaching Changes: The Role of Market Expectations, Race, and Former Players
- Rodney J. Paul, Syracuse University, rpaul01@syr.edu
- Andrew P. Weinbach, Coastal Carolina University
- Nick Riccardi, Syracuse University
Background
The topic of coach firings in professional sports has focused on both performance and race. For example, in previous studies of NFL coach firings, including Madden (2004) and Madden and Ruther (2009) showed that minority NFL coaches were discriminated against as white coaches were more likely to keep their jobs when similar performance was obtained. One element missing from these studies was the availability of performance expectations of coaches. Another study of college football in the United States investigated the firing of coaches, modeling them in the same fashion as corporate CEOs (Humphreys, et al., 2017). Although attempts were made based on past team performance, individual forecasts for the current season were not used (or presumably available to the researchers).
This study expands upon the topic of modeling the retention or firing of coaches by introducing market-based expectations into the process. Expectations for the upcoming season in many sports have a variety of futures markets available through wagering market outlets around the country and the world. These futures take the form of odds to win a championship, odds to win a conference, and season win totals, among others. The focus of this research is the use of season win totals as a proxy for expectations of team performance for the upcoming year. Using these market-based expectations, we can determine how well a coach performed compared to a expected level of performance to readily determine if the team and the coach outperformed or underperformed compared to expectations. This data adds additional information and insights beyond what could be determined from raw win-loss records alone.
Expectations and Coach Retention and Firing in the NBA
In this study, we were able to obtain futures market information on the NBA from the 1999-00 season through the 2018-19 season. 2019-20 was available, but not used due to the shortening and many disruptions to the season from the COVID-19 pandemic. Win totals were available for each NBA team in the league for this sample from the website www.sportsoddshistory.com. Win totals are market-based, as they are set by the sportsbook prior to the season. Bettors can then wager either over or under against the posted number. An over bet will be successful if the team wins more games than the posted total, the under bet will be successful if the team wins fewer games than the posted total, and if the actual wins are equal to the posted win total, it is a push with all bets returned. As with other prices (point spreads, totals, odds) set by sportsbooks, the win total serves as a forecast of future events, as market prices set by sportsbooks have generally been shown to be efficient.
Using win totals as a forecast of future events, these prices can serve as a proxy for expected team success. The higher the posted win total, the better and more successful a team is expected to be. These expectations likely have a major impact on NBA head coaches as their performance is judged not only by the actual on-field success, but also by their performance compared to market expectations. For instance, suppose two teams finished with identical 41-41 records in a given season. This performance could be anywhere from an extreme success story to an utter failure, based on expectations. If team A was expected to win 31 games, their record would be a positive testament to the coach and his staff. On the other hand, if team B was expected to win 51 games, their season would be deemed a disappointment. We assume that despite equal records, the coach of team A is much more likely to retain the coaching position with the team, while the coach of team B is much more likely to be fired.
Incorporating the futures data with team performance and coaching information from www.basketball-reference.com, we test for the role of performance compared to market expectations in terms of retention and firing of NBA head coaches. Using a logit model, the dummy dependent variable of whether a coach was retained or fired is modeled based upon actual team win percentage, the quadratic of the number of games in a coach’s tenure with that team, and performance compared to expectations. Additional models investigate the role of possible discrimination by introducing a dummy variable representing minority coaches and we also see if former players are given preferential treatment as coaches, also through the introduction of a dummy variable for former players in the model. Performance compared to expectations is modeled as the actual win percentage in a given year for a coach with his team minus the win total. Positive values for this variable denote outperforming market expectations, while negative values are disappointments.
Results show that actual win percentage has a negative and significant effect on whether a coach is fired (more likely to retain job with a higher win percentage) and team tenure is nonlinear (positive in games and negative in games squared). Performance compared to expectations is shown to have a negative and statistically significant effect, which implies that the better (worse) a team performs compared to expectations, it is less (more) likely a coach is to be fired. In addition, in this model setting, the dummy variable for minority coach is shown to be statistically insignificant meaning that race does not appear to have any informative value on whether or not a coach is fired during this sample. This result contradicts previous studies of minority coaches in the NFL, which could be due to racial bias being removed over time and/or due to the inclusion of expectations in the model, which was not available or used in previous studies. The dummy variable for the coach being a former NBA player was also found to be statistically insignificant, suggesting former players do not receive any sort of preferential treatment when it comes to retention and firing. The findings are consistent across different model specifications (i.e., using the win percentage of the coach during his tenure with the team instead of current season win percentage) and when the relationship is modeled as a probit rather than a logit.
These results illustrate that market-based expectations are important to include when measuring coaching performance and whether they retain their jobs. Similar logic can be extended to any field when considering CEOs or other top management positions in that expectations matter and should be included in models when the information is available. In sports, with futures markets being available, this is rather straightforward, while it may be more difficult to calculate in other fields due to scarcity of such data. In addition to the importance of market-based expectations, this study also reveals that racial bias against minority coaches in the NBA in terms of their performance and when they are fired is not statistically significant as we do not find evidence of racial bias. This is a positive finding in that it illustrates that within this sample for the NBA, coaches were treated the same, in terms of retention, independent of the color of their skin.
Example of Logit Model Results
Below is a sample of one of the table of results that have been modeled so far in this research. The dependent variable is a dummy that takes a value of 1 if the coach has been fired or replaced. Independent variables include season win percentage, the actual minus expected win percentage (expected taken from season win total in the futures market), games with team (and its square), dummy variable for a minority coach, and a dummy variable for the coach being an ex-NBA player. The sample includes all coaches who started the season. If the coach was fired mid-season, the win percentage and actual minus expected win percentages are based on the season sample at that point. The model is run as a logit. Coefficients are shown with *-notation for statistical significance and the z-stats are shown in parentheses. Other similar specifications and results of probit models are also included in the full paper.
Table I: Logit Model Results of NBA Coach Firing
Dependent Variable: Dummy for Coach Fired/Replaced
DO NOT shut up and DO dribble: the price of activism
- Matteo Pazzona, Economics and Finance, Brunel University London, matteo.pazzona@brunel.ac.uk
- Nicola Spagnolo, Centre for Applied Macroeconomic Analysis (CAMA), Australian National University
The title of the paper refers to the sentence ”Shut Up and Dribble”, used by the journalist Laura Ingraham to rebuke Lebron James for talking politics. We would like to thank Marco Barassi, Olivia Cassero, Alejandro Corvalan, Peter Dawson, Roman Gauriot and Giambattista Rossi. We would also like to acknowledge John Lewis, founder of Sports Media Watch, for providing us with the TV audience data. Finally, special thanks to Angelo Azzu, who helped with the Python codes. Corresponding author: Matteo Pazzona, Economics and Finance, Brunel University London, Middlesex UB8 3PH, UK. Email: matteo.pazzona@brunel.ac.uk
Keywords: Activism, and Black Lives Matter and Consumer Behaviour.
JEL Classification: D12, D80 and L82.
Extended Abstract
In an era of extensive social media activity, companies that only a few years ago would have adopted a low profile with regard to social issues such as immigration or racism, are now revising their strategies (Smith and Korschun, 2018). Global firms appear to be more prepared to take risky decisions intended to develop stronger ties with investors and customers, who are increasingly socially and politically active, and expect the same from brands they wish to either buy or invest in. As a result, it is natural to wonder whether this increased activism of companies has any impact on consumer behavior. This paper aims to shed light on this issue by using, as a case study, the engagement of the National Basketball Association (NBA) with the Black Lives Matter (BLM) movement.
BLM is a social movement, which originated in 2013 to protest against police brutality towards black people in the USA. In June 2020, following the death of George Floyd, protests erupted across the USA. Floyd’s death prompted one of the biggest civil rights movements in recent American history. Among the many supporters of the BLM, the National Basketball Association (NBA) has been one of the most prominent and outspoken. When play resumed at the end of July 2020, after the suspension due to Covid-19, the NBA took a firm but controversial position, allowing players to wear a social justice message on the back of their jerseys instead of their surnames, and painting the BLM slogan on basketball courts. The Black Lives Matter protests were endorsed by many leading players, as well as NBA commissioner Adam Silver. On June 1, 2020, he declared: “Together with our teams and players, we will continue our efforts to promote inclusion and bridge divides”. (It is worth noting that before the start of the 2020-2021 season, the NBA commissioner announced that the league would no longer place social justice messages on courts or jerseys. We take advantage of the fact that the NBA’s political activism was confined to a specific period (June – November 2020) and that the potential effect of political activism on viewers/ratings can therefore be tested.) The NBA made greater efforts to spread awareness about social injustice issues and push for change, compared to other major sports leagues. The position taken this time was certainly stronger and widely echoed by social media.
While the NBA’s BLM activism was intended to increase awareness of social issues, this endorsement was criticized by some politicians. For example, President Donald Trump tweeted, in September 2020 that: “People are tired of watching the highly political NBA. Basketball ratings are way down, and they won’t be coming back. . . ”. President Trump’s statement implied that consumers avoid firms that display too much political engagement. On the other hand, Adam Silver – the NBA commissioner – declared: “No data BLM on-court hurts NBA ratings. There is no doubt there are some people who have become further engaged with the league. They respect their right to speak out on issues that are important to them”. These views raise two questions. Does activism have an impact on the TV audience? More generally, does making a clear stand on social and political themes hurt demand for a business? Answering these questions in the context of the involvement of the NBA with the BLM movement, means facing two main empirical challenges. The period under consideration coincided with the postponement of the season due to the COVID-19 pandemic. Moreover, the NBA – along with other professional sports leagues – has consistently lost viewers in recent seasons, mainly due to the increased use of online platforms. (Over the last few years, the National Basketball Association (NBA) has been consistently losing viewers. Ratings also declined substantially (37%) between the 2019 and 2020 seasons (Sport Media Watch, 2021). The same trend was observed even before the pandemic, with figures for both viewers and ratings showing a steady and marked decrease. The latest trends are a matter of concern for media giants such as ESPN and Turner Sports, which signed a nine-year deal with NBA in February 2016, worth $24 billion – a combined $2.6 billion per year on average (Invistopedia, 2021).) How could we disentangle the role of NBA activism from these other concurrent factors? First, we conducted an event study, employing high-frequency data and taking into consideration the factors that could have influenced both the TV audience data and the “perceived” NBA activism. We gathered data on the TV viewers and ratings for all the NBA matches shown on the national US networks in the 2018-19 and 2019-2020 seasons.
Although TV audience data does not represent a standard measure of consumption, it is strictly related to revenues (Kanazawa and Funk, 2001). (Using data on Nielsen ratings for locally televised NBA basketball games, Kanazawa and Funk (2001) found that higher ratings allowed NBA teams to realize greater advertising revenues.) To measure the perceived level of NBA activism in the BLM movement, we gathered data from Twitter – a popular social media platform which has been increasingly employed by researchers (Acemoglu et al., 2018; Gorodnichenko et al., 2021). We calculated the total daily number of tweets with hashtags referring to both the NBA and BLM. The results show that social and political engagement did not affect TV viewers and ratings. We also report some evidence suggesting that tweets with a negative tone are negatively related to viewing figures.
Furthermore, we employed a difference-in-difference (DiD) approach, using the National Hockey League (NHL) as a control. The NHL provided an ideal comparison with the NBA, in particular because both leagues experienced a similar break due to Covid. Our results, in line with previous findings, suggest that the decision of the NBA to allow players to express their activism and beliefs did not contribute to the decline in viewers and ratings. Our work relates to various strands of the literature. Firstly, it contributes to the strand which analyzes whether the intensity of media coverage, and its tone, affects consumer behavior (Carroll, 2003; Lamla and Lein, 2014; Lerner et al., 2007; Biolsi and Lebedinsky, 2021). (For example, Soroka (2006) showed that the responses to positive and negative information are asymmetric.) The last of these studies analyzed how consumer spending changed in response to news coverage of the investigation into collusion between Donald Trump’s presidential campaign and Russia. This work depends on the idea that when a given individual receives news favorable to his/her preferred political party, he/she will feel more optimistic and thus spend more. We use a similar argument and investigate whether individuals sharing (or not sharing) the view that the NBA should engage in political activism would make them more inclined to watch (or not watch) televised NBA matches. However, we find that there is no effect of news coverage on consumption and that only a limited role is played by tone. Our work also contributes to the literature connecting beliefs with consumption patterns (Angeletos and La’O, 2013; Benhabib and Spiegel, 2019; Gillitzer and Prasad, 2018). These studies recognize the role of non-fundamental factors – such as beliefs and opinions – in the spending decisions of individuals. Within this context, recent literature has found that social media is increasingly influencing beliefs and fostering activism among consumers (Bovitz et al., 2002; Enikolopov et al., 2020; Hendel et al., 2017; Gorodnichenko et al., 2021; Zhuravskaya et al., 2020). (Gorodnichenko et al. (2021) showed that social media diffusion had a profound influence on opinions related to the Brexit referendum and the U.S. Presidential Election in 2016. Larson et al. (2019) highlighted how individuals involved in the 2015 Charlie Hebdo incident were much more connected than those not involved. Similar findings have been found by Halberstam and Knight (2016). Enikolopov et al. (2020) found a robust link between the penetration of social media and protests in Russia in 2011.) In our context, we explore the consequences of the NBA’s activism, with Twitter functioning as an echo chamber.
Furthermore, this work adds to the literature investigating the social and economic consequences of protests (Acemoglu et al., 2018; Collins and Margo, 2004). For example, Acemoglu et al. (2018) found that firms connected to the political party of President Mubarak saw a decrease of 13% in its share price following Egypt’s involvement in the Arab Spring. Our paper uses the TV audience as a proxy for consumption, as it is linked to advertising revenues (Kanazawa and Funk, 2001).
Finally, this work is also linked to the recent marketing literature that investigates whether social and political activism affects a firm’s performance (Smith and Korschun, 2018; Scherer et al., 2014). Our work contributes to this literature by clearly isolating the role of the firms’ involvement from that of other co-founders.
American Football-Fans in Germany: Far away and yet so close!?
- Kristoff Reichel, University of Bayreuth, kristoff.reichel@uni-bayreuth.de
- Christian Brandt, University of Bayreuth
- Markus Kurscheidt, University of Bayreuth
Motivation and purpose of the paper
The Super Bowl, the annual finale of the American football competition, is one of the greatest sport events in the world and has been followed in Germany by more than 2 million sports fans in the year 2021 (Kreisl, 2022). In contrast to the continuously growing American football fan scene in Germany the active sport participation counts merely 72,000 members in the umbrella organisation `American Football Verband Deutschland e.V.´ (AFVD), although the sport has been anchored in the association and club organization in Germany since the early 1990s. The AFVD’s flagship is the German Football League (GFL), whose finale, the German Bowl, attracted more than 20,000 fans to Frankfurt’s Commerzbank Arena in 2019. The fact that European American football also has international aspirations is shown by the NFL Europe project, which was an attempt to globalize the sport from the USA and import it to Germany between 1995 and 2007 (Beldon et al., 2020). Due to economic unprofitability the increasingly unstable league was dissolved (Volpe, 2007). With the founding of the European League of Football (ELF), a new league has existed in Europe since June 2021, which is attempting to revolutionize American football on the European continent with eight teams, six of which are from Germany. The NFL (National Football League) has also recognized the strong increase in fan interest in Germany in American football, especially in the NFL, and the associated potential for the commercial sports market. Thus, starting in the 2022 season, NFL games will be played regularly in German stadiums for the next four years. When considering the apparent contradiction between the great attention and obvious growing popularity of the NFL on the one hand and rather underrepresented national structures in American Football without great public relevance on the other, the following research question arises: Which factors determine fan interest in American football in Germany?
Theoretical and empirical description
Wann et al. (2001) confirmed that distinction between direct and indirect spectators of sports is necessary. Direct refers to attending live sports events means indicative of true fanship, while indirect stands for following spectating sports through the media. Further distinctions and classifications of fans or spectators, such as Giulanotti (2002) for football, may relevant especially for `attendance sports´ with present fans. Supplementary, Crawford (2004) emphasizes the need for an understanding of contemporary fan culture that includes as wide a range of fan behaviour as possible and not just traditional forms of fan activity.
In the case of the NFL, Martin (2013) dealt with the fan loyalty of supporters towards their fan object, e.g., a team. His results show that increased social motivation for consuming American football increases a fan’s commitment. This in turn results in an increase in behavioural loyalty, which is reflected for example in purchasing behaviour. Shane-Nichols et al. (2021) also identify team loyalty as one of three criteria found in a prototypical NFL fan. They cite sport-specific knowledge and the wearing of team-related clothing as further criteria. In contrast to local attachment to a team, Tainsky and McEvoy (2012) examined television demand in markets without local teams. They show that, for example, the age of an organisation with an eventful history contributes to fan identity and the selection of a favourite team. Nevertheless, fans can show a high level of identification with a team despite the lack of a regional connection, which is highly significant regarding the present study.
For data collection an internet-based highly structured online survey in cross-sectional design was used. In accordance with the theoretical framework, the developed questionnaire covers items on general consumer behaviour (Q1), fans‘ American football interest, consumption and identification (Q2-Q11), general sports interest (Q12) and socio-demographic information (Q13-Q18). Almost exclusively closed questions were chosen with dichotomous, multiple response or 5-point (Q1-Q10) respectively 8-point (Q11) Likert scales. Following the process of generating and refining items included 20 non-standardized pretests, the questionnaire was distributed from 29 July through 8 August 2021 by social media channels and Fan-Based-Internet-Sport-Communities (FBISC). In addition, all teams from the GFL and GFL2 (32), the regional leagues (47) as well as the state associations (14) and the German umbrella organization of the AFVD were contacted by mail.
A convenience sample of 4,154 American football fans in Germany took part in the survey. As not all participants completed the questionnaire (except sociodemographic information), a total sample of N=3,469 were used for the data evaluation. While the age (M=37.9, SD=10.73), income distribution (M=3.9, i.e., 2001-3000€ monthly net income, SD=1.2 with 6 income groups) and education (34% with academic degree) in the sample is quite balanced, male (79,6%) respondents predominate. The data on postcodes show a nationally even distribution in relation to the population density of the various regions (the federal states of Thuringia, Saxony and Saxony-Anhalt are clearly underrepresented here). For the key analysis, linear multiple regression will be run on constructs of total consumption of American football measured in 5-point and 8-point Likert scales considering a set of about 30 explanatory variables. Full and reduced models with index variables on key determinants proposed by the theoretical approach (e.g., attendance, fan identity, consumption, involvement) as well as ordered and binary variants will be tested for robustness checks. However, the econometric analyses are not yet finalised. They will be presented at the conference. Therefore, in this abstract, the early descriptive findings are discussed.
Main results
Most respondents have a strong interest in sports (M=3.9, SD=1.2) and inform themselves regularly about sports in general (M=4.7, SD=0.6) as well as American football (M=4.5, SD=0.8). The high level of identification with the sport is expressed in the fact that 37% regularly engage with American football and 58% see the sport as a `fixed part of my life´. More than 95% of all respondents follow the NFL. The European league ELF, newly founded in 2021, is regularly followed by 73% and the highest German division GFL by 43%. Almost all fans of the GFL and EFL are also interested in the NFL, with 31% of respondents following all three leagues. Due to the high presence of the sport on TV and social media, 46% of the respondents have become involved with American football. Furthermore, social contacts have a high influence. It was mainly through friends (44%) or the family (19%) of the respondents discovered their interest in the sport. About 23% of the respondents play American Football (18% organized in a club, 5% unorganized) and 38% stated that they watch American football games on site. A clear majority of 87% watch the matches on free TV, while 52% watch it on pay TV channels such as DAZN. Content about American football is consumed via the internet (88%), for example through social media (87%) or various apps (56%).
The close fan bond with a team (especially an international one) is closely linked to the identification with the sport of American football. Furthermore, the media significance for German fans should be emphasised. In the process, fans step out of the shadow of passive consumption and become active participants in a media discourse. Additionally, previously common barriers such as regional dependency as well as the need for real social contacts are not compelling criteria for access to the sport. In the next step of the econometric analysis, it will be interesting to find out about the inner structure of these preferences. These results will be helpful to understand more about this new, mostly younger, fan scene from sports, e.g. also Darts, that are less popular in the (active) sport participation as we know it from traditional team sports in Germany.
Exit strategies of investments into football clubs
- Prof. Dr. Maria Ratz, Accadis University of Applied Sciences, maria.ratz@edu.accadis.com
Motivation and purpose of the paper
The current war in the Ukraine has also left its mark on sports. In particular, the Premier League club FC Chelsea is currently being hit hard by the sanctions against Russia and Russian oligarchs. Roman Abramovich’s British assets have been frozen and he is not allowed to continue as a board member of the club. He has also been on the EU’s sanctions list (Zeit Online, 2022). In addition, Chelsea FC is not allowed to sell matchday tickets or make player transfers (Sportschau, 2022a); training and match operations are also to be maintained with regard to the other league participants. Abramovich himself had previously tried to sell the club at short notice (Sportschau, 2022b), but an exit could not be completed so far. Now there is a new deadline, and most probably the club will be sold by mid-April 2022 with four potential investors still on the shortlist (Marca, 2022).
This hasty and unplanned process raised the question whether clubs and their investors should discuss potential exit strategies in a more professional way and in earlier stages of their relationships – not only when (unexpected), external circumstances lead to the decision that an exit is almost inevitable.
Theoretical background
Exit strategies are part of almost every investment consideration in the business context and are becoming increasingly important to scholarship and practice (DeTienne et al., 2015). Lemley and McCreary (2021), therefore, introduce their article as follows: “In Silicon Valley, the most important thing to think about when starting a company is how you’re going to end it.” However, Peters (2009, p. 4) acknowledged: “Exits are the least understood part of investing and entrepreneurship.” And according to DeTienne et al. (2015), there is still not enough knowledge about the factors that drive the decision for entrepreneurial exit strategies.
That is even more true for sports investments. In this context, for example when taking over a club, the topic of exit has hardly been discussed, at least in the literature – possibly also because it contradicts the ideal of the classic even philanthropically inclined investor in sport? Although more and more professionalism and extremely large sums of money are involved when a club is bought or investments are made in sport, this aspect has so far been neglected in the literature, but also in practice, and represents both a gap in research and practical discussion.
Methodology
Following on an article by Rohde and Breuer (2017), it is necessary to further investigate the market for football club investors, also with regard to IPOs, sales and multi-club ownership. This and similar research articles, as well as current political events, build the rationale for this study described in this paper.
It categorises previous sales of football clubs with classical investment theory and the exit classifications established there (Cumming et al., 2008; Karakaya, 2000). The main drivers for exit decisions will be statistically analysed. Cluster analysis will be conducted in order to group the reasons for club sales and investment exits based on observed variables such as holding period, price and sporting success.
Data on club sales in the European Big Five from 2010 to 2022 is included in the first phase of the study. Later one, the inclusion of more data sets, for example, Non-Big Five leagues in Europe as well as the MLS and other international leagues will be added.
Preliminary Results
Due to the topicality of the research approach, the full results of the analysis will only be available in a few weeks. However, it is already apparent in the early and descriptive phase of data collection and analysis that, in particular, political and regulatory influences play a central role in the sale of football clubs. Some leagues exclude multi-club ownership by regulation, which led for example to the sale of the Italian club US Salernitana after a special permit expired. The current withdrawal of Chinese investors from the football market is also due to political motivations (Deutsche Welle, 2021). The circumstances and observed variables, in particular, the holding period vary a lot.
Conclusion and Implications
Investors and their shareholdings in football clubs are becoming increasingly important in the football market (Rohde and Breuer, 2017). Even in the Bundesliga, which is heavily regulated by the 50-plus-1 rule, investors are appearing more and more frequently, as the example of Lars Windhorst at Hertha BSC shows. Both sides deny an exit so far, but discussions and disagreements characterise the current picture and highlight that an exit could be earlier part of the discussions as planned. Hence, several factors could force the clubs, but also the investors, to strategically plan the entire life cycle of the investment in advance and to take exit strategies into account, as they are quite often defined in business at an early stage.
Professionalism and strategic planning are still required when the cooperation is to be terminated. The reasons for the exit can be manifold, but in order not to get a club into trouble in the short term, as is currently happening at Chelsea FC, the feasibility and preference of various exit options should be part of the discussions, at least in the long term. These, in turn, need to be accompanied and underpinned scientifically and hopefully this paper will contribute to this.
Customer Discrimination in the Field: The Impact of Supporters’ Right-Wing Political Attitudes on Ethnic Team Composition in German Professional Soccer
- Ulf Rinne, IZA – Institute of Labor Economics, Germany, rinne@iza.de
- Hendrik Sonnabendt, University of Hagen, Department of Economics and Business Administration, Germany, hendrik.sonnabend@fernuni-hagen.de
- Leonie Wolters, University of Hagen, Department of Economics and Business Administration, Germany
In the labor market, customer discrimination is the result of a significant share of customers not willing to interact with minority workers. This form of discrimination may even arise if the employers themselves are not prejudiced, i.e., taste-based discrimination or ethnic discrimination on behalf of employers is not present. Furthermore, unlike other forms of discrimination such as taste-based discrimination, customer discrimination is rooted in profit maximization (Combes et al., 2016; Becker, 1971). It can thus be sustained even in a competitive environment.
Motivation
Against this background, we analyze customer discrimination as a potential source of heterogeneous ethnic team composition in German professional soccer. As we analyze the effects of customer discrimination on team composition across three different league levels in German professional soccer, we can also shed some light on how different regional catchment areas and geographic spreading of fan communities affect the analyzed mechanism.
Methods
Key to our empirical strategy are the 2017 federal elections in Germany that rep- resented a shift in the political landscape. Specifically, after the 2015 split of economic liberals, the Alternative for Germany (German: Alternative für Deutschland, AfD, founded in 2012) turned into a right-wing populist party and a ‘low cost’ option (in terms of social stigma) for far-right voters to articulate their political preferences (Cantoni et al., 2019).
Following the idea that customer preferences manifest in voting behavior, we analyze the influence of xenophobic attitudes of supporters on the ethnic composition of teams in German professional soccer. Xenophobic attitudes are operationalized by regional voting shares of the AfD, whereas ethnic team composition is operationalized on the basis of players’ external appearance, i.e., their skin color, and on the basis of their nationality. The 2017 federal elections work as an exogenous shock to consumer preferences based on a decrease of the relative costs of exposing latent attitudes.
Our data come from two sources. First, information on regional election outcomes as well as economic and social indicators were obtained from the Federal Statistical Office of Germany Second, data on soccer teams such as market values and players’ age were collected from the Transfermarkt.de website. Player portraits presented at this website were used to categorize skin tones according to the scale developed by Massey and Martin (2003). In sum, our data set includes team-season information over seven full seasons and three leagues: 2014-2015 through 2020/2021 and 1. Bundesliga (first division), 2. Bundesliga (second division), and 3.Liga (third division), 369 observations altogether.
Our empirical strategy is twofold. First, we expect the impact of changes in (revealed) consumer preferences to be stronger for lower division teams that rely more on local markets compared to top division teams that aim for the national or even global market. Therefore, we fit a difference-in-differences (DID) model of white German players in a team given by
sit = αi + βt + τ Dit + Xi′tβ + ϵit , (1)
where the subscripts i and t denote team and season, respectively. The dependent variable, sit, is the team’s share of white German players, αi represents team fixed effects, and βt denotes season fixed effects. Dit is a dummy for third-division-post-elections teams and years, and Xit is a vector of control covariates including absolute and relative team market values, a county’s per capita GDP and share of foreigners, and the stadium capacity to county population ratio.
Second, we account for the remarkable regional differences in AfD votes by estimating a model of white German players conditional on the regional AfD success in the 2017 German federal election. In addition to the vector of the previously describes covariates, Xit, the model includes season and year fixed effects.
Preliminary findings
For the DID model, estimates of the average treatment effect on the treated (ATET) are
0.052 (SE: 0.025) for the unconditional and 0.044 (SE: 0.025) for the conditional effect. Evaluated at the pre-treatment sample mean for the third division teams of 0.66, this means that these teams on average have increased the share of white German players after the 2017 state elections by 6.63%.
Results from the second regression model indicate that a one standard deviation in- crease in AfD support is associated with an increase in the share of . . .
- . . . white players by 1.79 percentage points (ppts.) or 2.5% at the sample mean and
- . . . white German players by 1.95 ppts. or 3.3% at the sample mean
. . . for teams of the second and third division.
Estimates from a model where we regress a team’s success (in terms of final points and ranking position) on the share of white (German) players give a mixed picture.
Disability, volunteering in sports, and social capital
- Katrin Scharfenkamp, Bielefeld University, katrin.scharfenkamp@uni-bielefeld.de
- Pamela Wicker, Bielefeld University
- Tim F. Thormann, Bielefeld University
- Larissa Davies, Sheffield Hallam University
Introduction
Currently about 15% of the worldwide population have a physical, mental, or both forms of disability temporarily or permanently. This number is expected to grow in the future due to an ageing population, but also the prevalence of new diseases. The environment of individuals with disabilities is known to have an effect on the experience of individuals with disabilities, for example in terms of limited social support and inclusion. To enable the full participation of individuals with disabilities in society, it is necessary to understand the barriers and facilitators that improve their social participation (World Health Organization, 2022).
In this study, we focus on grassroots football and individual social participation in terms of social capital in football clubs. Following Putnam (1993), social capital is reflected by individuals’ relationships, their overall network, and trust. Social capital is categorized in bonding, bridging, and linking capital. This study focuses on bonding capital meaning the strength and density of local ties of individuals (Putnam, 2000). Having a disability might represent a constraint for both volunteering and for the development of social capital. This study proposes two research questions: (1) How does having one or more disabilities affect the likelihood and extent of volunteering in grassroots football? and (2) How does having one or more disabilities and volunteering affect the perceived level of social capital in football clubs?
Theoretical underpinning and related literature
This study is based on leisure constraints theory (Crawford et al., 1991) which states that intrapersonal (e.g., type and extent of disability), interpersonal (e.g., partners or family), and structural restrictions (e.g., monetary and time resources) may occur (e.g., Sotiriadou & Wicker, 2014). Thus, we assume disabilities to be an intrapersonal constraint to participate in volunteering. Previous literature shows that the low number of volunteers with disabilities (Phoenix, 2008) might be caused by functional dependence on the environment (Kerr et al., 2012), feared rejection, a lack of cooperation of able-bodied individuals, and exclusion in their social environment (Hall, 2010). Thus, we hypothesize that individuals with disabilities might have a significantly lower probability to volunteer than individuals without. Even though the relationship between volunteering in sports and social capital has been widely studied (e.g. Cuskelly, 2008), the role of individual disabilities has not been fully understood yet. Existing research has found that individuals with disabilities have lower levels of social capital than those without (e.g., McPhedran, 2010), especially regarding bonding capital (Llewellyn et al., 2013). Consequently, we hypothesize that individuals with disabilities perceive their level of social capital in sport clubs as significantly lower than able-bodied individuals. However, and based on the motivational model by Mannell and Kleiber (1997), we suggest individuals with disabilities might have a motivation to volunteer to overcome loneliness and satisfy the psychological need of bonding with other people (Gage & Thapa, 2012). This assumption is supported by findings that volunteering in sports enlarges the social network (Kay & Bradbury, 200), stabilizes personal involvement (Cuskelly, 2008), and enforces norms among e.g., club members (Morgan, 2000). Hence, while having a disability might be a constraint for social capital development, volunteering might mitigate this negative effect of disability on social capital. Accordingly, we hypothesize that volunteering in sport mitigates the negative effect having a disability on social capital.
Method
Quantitative data were collected from November 2020 to June 2021 across seven European counties including Germany, Switzerland, France, Italy, England, Norway, and Poland using online surveys. The survey link was distributed by the respective national football associations, resulting in a convenience sample of n=21,558 respondents including a sub-sample of n=16,989 volunteers. The dependent variable was an index measuring bonding capital, which was developed using the social capital scale of Chen et al. (2009) and applied to football clubs. The index is based on the following four items: Participants were asked to rate the number of friends in their club, the number of people they keep a routine contact in their club, the number of people in their club they trust, and the number of people in their club who would definitely help them upon request, on a five-point scale. With a Cronbach’s alpha of 0.705, the scale can be considered reliable (Hair et al., 2010), and can thus be subject to further analysis. The social capital index reflects the mean value of these four items.
Results and discussion
The results of logit regressions, explaining the probability for a respondent to volunteer in European grassroots football, reveal that individuals with disabilities have a significantly lower probability to volunteer than respondents without, thus supporting our first hypothesis. Differentiating the type of disability (physical, mental, or both) shows that respondents with physical disabilities significantly drive this effect. Focusing on the subsample of volunteers, we find that volunteers with disabilities dedicate significantly more hours to volunteering than those without. Again, this effect is driven by volunteers with physical disabilities.
The findings of linear regressions for social capital in football clubs point out that volunteering is significantly and positively associated with social capital. According to our theoretical considerations, volunteering might thus be a facilitator of social capital development in football clubs. By contrast, we find that respondents with disabilities evaluate their level of social capital significantly lower than respondents without, hence indicating that having a disability represents a constraint of social capital. Hence, the second hypothesis is supported. Focusing on the type of disability, respondents with mental disabilities have a significantly lower evaluation of their social capital in football clubs than respondents without. The interaction terms of volunteering and disability measures are all insignificant, indicating that social capital is not significantly differently evaluated by volunteers with or without disabilities. This finding supports our third hypothesis and volunteering as a moderator. For the subsample of volunteers, the previous negative association for individuals with disabilities and bonding capital (compared to those without) remains significant and negative. Especially for volunteers with physical and mental disabilities, we find a significantly lower level of social capital than for able-bodied volunteers. While the invested hours of volunteering are significantly positively related to social capital, the interaction terms reveal no significant differences between volunteers with or without disabilities. Again, we find support for our third hypothesis.
While our results reveal that individuals with disabilities have a significantly lower probability to volunteer in sport and perceive lower levels of social capital, the findings suggest that volunteering helps to mitigate negative social outcomes resulting from having a disability. Put differently, once individuals with disabilities volunteer in sport, their perceived level of social capital does not differ from able-bodied individuals. This finding indicates that volunteering helps to compensate the lower evaluation of bonding capital for this group.
The present, preliminary findings are based on conventional regressions and cannot exclude the potential of reverse causality. The next step is to examine the causal link between volunteering in European grassroots football and social capital for individuals with or without disabilities by estimating instrumental variable regressions.
Wages, Dispersion, and Performance – Insights from the German 3. Liga
- Daniel Philipp Schettler, University of Latvia, Riga, Ds17179@lu.lv
Abstract
Compensation research has often discussed the effects of wage dispersion on performance. Results of the substantial literature in the field differ a lot and offer a wide variety of outcomes. This paper focuses on the effects of horizontal wage dispersion on individual performance. Therefore, a sports data set from the German football league 3. Liga was used to test for possible effects of wage dispersion on the performance of professional football players.
In the first step, wages were estimated for each player based on individual characteristics. In a second step, the influence of absolute wage, relative wages, and wage differences on individual performance was tested. The results neither support previous findings of a mediating effect of wage dispersion on the effects of absolute and relative wages nor a significant influence of wage dispersion on individual performance. Nevertheless, a positive influence of absolute and relative wages on individual performance can be confirmed by the study results.
Keywords: compensation, wage dispersion, performance, football
JEL code: M52
Introduction
Gupta and Shaw (2014) underline the importance of compensation schemes in organizations: “In virtually every aspect of organizational functioning, compensation can shape employee behavior and organizational effectiveness” (Gupta & Shaw, 2014, p. 1). In contrast to the stated importance stands the relative scarcity of research on employee compensation (Gupta & Shaw, 2014).
Among other issues, compensation researchers face the challenge of getting access to compensation data. Therefore, this conference paper uses a sport setting from the German football league 3. Liga. Sports data sets have, besides the often-provided wage data, several advantages. “There is no research setting other than sports where we know the name, face, and life history of every production worker and supervisor in the industry. Total compensation packages and performance statistics for each individual are widely available, and we have a complete data set of worker-employer matches over the career of each production worker and supervisor in the industry” (Kahn, 2000, p. 75).
Nevertheless, the specialties of such a data set have to be considered when the results are interpreted. Harder (1992) reminds us that the research results might differ in a setting in which it is more challenging to observe performance. Werner and Ward (2004) mention in their literature review of compensation-related issues that the vast majority of papers use North American samples. Most studies on the effects of wage dispersion focus on US sports leagues, dominated by Major League Baseball (Franck & Nüesch, 2011). These studies differ not only by the considered sport but also in their conclusions on the effect of differences in wages on performance. “Despite an increasing number of studies, research evidence on the effects of pay dispersion has not yet been consistent” (Downes & Choi, 2014, p. 53).
Studies using a non-North-American sample still face the challenge of non-disclosed wages because compensation packages are not publicly disclosed in other parts of the world, like Europe. For this reason, researchers use proxies for the player’s wages. Fortunately, football is a very popular sport around the globe, which also leads to many available data sources. Sports magazines or specialized corporate providers offer a wide variety of data. The author uses data from two different sources, the webpage transfermarkt, and the German sports magazine kicker. Football’s popularity is also reflected in science. Many researchers used football as a research setting (Della Torre, Giangreco, & Maes, 2014; Deutscher & Büschemann, 2016; Franck & Nüesch, 2011; Frick, 2006). Besides the mentioned scarcity of compensation research, research on the influences of wage dispersion is a topic of great interest in the organizational and management literature (Shaw, 2014; Trevor, Reilly, & Gerhart, 2012). Table 1 displays relevant studies focused on wage dispersion’s impact on individual performance. The vast majority of research focuses on the effects of wage dispersion on team performance. The number of studies concentrating on individual performance is significantly smaller.
| Study | Dataset | Dependent variable | Dispersion measure | Effect of wage dispersion on performance |
| Della Torre et al. (2014) | Football; Italy | performance measure | Coefficient of variation | Relative dispersion positively significant Absolute dispersion positively significant |
| Harder (1992) | Baseball; North America Basketball; North America | composite performance | Underreward Overrewarded Residual/log wage | Baseball – underrewarded almost no significance Baseball – overrewarded partially positive significant Basketball – underrewarded almost no significance Basketball – overrewarded almost no significance |
| Simmons & Berri (2011) | Basketball; North America | composite performance | Gini coefficient | Gini Predicted – positively significant Gini Residual – no effect |
| Bloom (1999) | Baseball; North America | different measures | Gini coefficient Coefficient of variation | Gini coefficient – mainly negatively significant Coefficient of variation- mainly negatively significant |
| Brandes and Franck (2012) | Football; Germany | composite performance | Fair wage Unfair wage | Fair wage – positively significant Unfair wage – negatively significant |
Table 1: Studies focusing on the effects of wage dispersion on individual performance
The theoretical literature focusing on whether differences in wages are beneficial to performance or not is also broad. Grund and Westergaard-Nielsen (2004; 2008) use the term fairness approaches for the theories supporting an egalitarian wage structure. Like equity theory (Adams, 1963), such theories state that differences in wages could demotivate employees or lead them to withhold effort. In contrast, approaches like tournament theory (Lazear & Rosen, 1981) support a positive relation between dispersed wages and individual effort. Consequently, tournament theory proposes a more hierarchical wage structure.
The author uses team sports as a research setting, which implies that the wage differentials between a group of employees of the same organizational level are examined. The term horizontal wage dispersion is used to describe this circumstance in the literature. “Horizontal pay distributions hold constant many potentially confounding factors (e.g., differences in status, social class, job titles) that could reasonably explain variations in pay levels. They highlight performance, justice, and legitimacy issues among relevant comparison individuals” (Shaw, Gupta, & Delery, 2002, p. 509).
This paper focuses on the research results of Della Torre et al. (2014), which analyzed the influence of wage dispersion on individual performance and its mediating effects on absolute or relative wages in golden team settings. For the authors, the term golden teams describes a group of high-paid employees, among other characteristics. In contrast, this study uses data from the German 3. Liga. In this league, the average employee is supposed to earn a significantly lower wage than in the research setting of Della Torre et al. (2014). Equally to the mentioned study, this paper tests the influence of wage dispersion, the relative wage, the absolute wage, and the combined effect on individual performance.
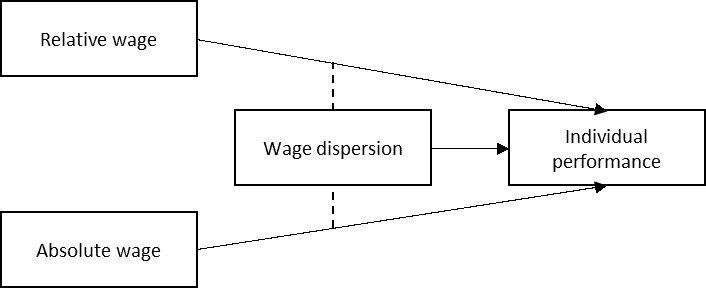
Figure 1: Theoretical Framework (Own figure, based on: Della Torre, Giangreco, & Maes, 2014, p. 87.)
Additionally, the effects of explained and unexplained wage dispersion will be tested. In the literature, Trevor et al. (2012, p. 590) define unexplained wage dispersion as the part of the wage which can not be explained by productivity-relevant inputs, like human capital. Therefore, a wage estimation model will be established first to be able to distinguish between the explained and unexplained wage dispersion.
In toto, this conference paper tries to add new insights to the existing literature, focusing on the effects of wage dispersion on individual performance.
Rabbits Caught in the Headlights: Mispricing New Information in a High Stakes Environment
- W. Benedikt Schmal, Duesseldorf Institute for Competition Economics (DICE) at Heinrich Heine University
- Kai Fischer, Duesseldorf Institute for Competition Economics (DICE) at Heinrich Heine University, kfischer@dice.hhu.de
Introduction
The superiority of pooled over individual evaluations has been discussed in a large variety of settings. It originates from the fundamental understanding of markets as large, decentralized aggregators of information as outlined by F. A. Hayek and formalized later on. Particularly interesting in this context are prediction markets. Different from many financial products, there exist outcomes for sports betting that can be used to evaluate prior predic-tions. The incorporation of new information into established prediction models is of high relevance as financial markets heavily rely on the accurate reception of new information that may affect the value of shares or insurance policies.
We exploit a quasi-natural experiment in the high-stakes environment of sports bet-ting: The global COVID-19 pandemic allows us to unambiguously identify the absence of players due to coronavirus infections. These are exogenous information shocks to bookmak-ers and bettors. Hence, betting odds are an ideal outcome variable to analyze. Professional men’s soccer in Europe applied a rigorous testing scheme for the virus. Players were forced to quarantine for more than a week following a positive result, such that they were missing at least one match. As infections usually were made public (unlike most sicknesses or absences of players) this allows for precise separation of “treated” and “control” matches.
Compared to the existing literature, the time window of several days ahead of an event applies to much more market settings. Furthermore, our analysis is not limited to a specific shock but a fairly general assessment of the incorporation of novel information, which is relevant for an outcome but not an extreme event. As this description may apply to most new information – some potentially meaningful news without landslide importance – our contribution is constituted by the generality of the “shock” we use. Furthermore, we pro-pose several behavioral hypotheses we can test empirically using the parsimonious setting of the first three moments of the distribution of odds. Our results may be reflected in many in-stances and might spark replications in different market environments.
Data and Methodology
The foundation of our analysis is the closing odds of 32 bookmakers obtained from the website oddsportal, which serves as a major archive of odds in a variety of sports. The market for online gambling and sports betting is highly entangled. This is because many betting brands only operate in selected markets or are sub-licensed to other companies because of legal reasons. According to the European Gambling & Betting Association (EGBA), the market for sports betting had a size of € 14.64 billion in 2020. We cover the seasons 2019/2020 and 2020/2021 of the elite leagues in Germany (Bundesliga) and Italy (Serie A). There are COVID-19 infections in the later stages of the 19/20 season and for the whole 20/21 season with a particular peak in winter 2020/2021. The Bundesliga comprises 18 teams, the Serie A 20 teams. This results in a total number of 1,372 matches. To obtain a balanced team-matchday panel, we double the data set as the 1X2 odds are defined by match and not by the team. We cluster the standard errors at the match level to take this into ac-count. In total, we make use of 117,174 single odds and rely on the most important bets in soccer betting.
We analyze the effect of a new announcement of a missing player on the betting odds of the respective teams and their opponents. This captures two effects: First, the choice set of the coach decreases, which weakly lowers quality. Second, due to the absence of a player, the squad on the pitch might need an adjustment. Our reduced-form estimation for betting odds aggregates both of these issues and captures the resulting uncertainty of how a team’s quality might change because of this. Empirically, we apply a difference-in-difference design that uses the date of infection as information shock that should affect the bookmakers’ forecasting. The dependent variable is the logarithmic measure of the closing odds of book-maker i for team t in match m – either the mean, the standard deviation, or the skewness across all bookmakers in the market. We additionally separate our sample into two groups: early and late infections, split at the median infection date. two groups at the median infection. Intuitively, a distinction between seasons might suggest itself. To extend our analysis, we also apply a dynamic difference-in-differences setting in the form of an event study.
Results and Interpretation
Running difference-in-differences regressions for all three statistical moments and separated into early and late infections, a diffuse picture emerges in economic terms. The table below summarizes our empirical findings: Bookmakers do not react at all to new infections in the beginning. Only after a long period of inertia do we identify a higher mean, higher dispersion, and a more left-skewed distribution of odds. While we do not identify a reasonable behavioral pattern across new announcements, we hardly find any learning among the group of bookmakers after a new absence announcement either. Among matches in which betting firms do not act fully rational, they seem to revert to status ex-ante after one match of confusion. However, this could be driven by the return of absent players. While learning would back the Hayek hypothesis (Smith, 1982) of quick information transmission within markets, it remains unclear why we find an effect only for late infections and why bookmakers react like this.
| Statistical Moment | Early Infections | Late Infections |
| Change in mean | x | x |
| Change in std. deviation | x | x |
| Change in skewness | x | x |
Our findings question to which extent the strength of market environments, as cap-tured by the Hayek hypothesis, still holds for new information. Exploiting COVID-19 as ex-ogenous information shock has proven that price adjustments do not necessarily reflect the rational benchmark. The actual response to the new information rather seems to consist of inertia combined with lagged blind action: Even though we cannot rule out alternative ex-planations for the null effect among early infections, an explanation that argues in favor of rational behavior in response to this first half of the sample lacks a sufficient explanation, why this rationality is lost in the second half of the sample.
The hypothesis of “rabbits caught in the headlights” appears as the most intuitive ex-planation for this unintuitive set of outcomes. Buchanan (1964, p. 218) stated that “a market is not competitive by assumption or by construction. A market becomes competitive.” For our setting, we find the opposite.
Judge bias in Aesthetic Group Gymnastics
- Seppo Suominen, Haaga-Helia University of Applied Sciences, seppo.suominen@haaga-helia.fi
Introduction and motivation
There are several competitions where the objectivity of judges has raised some questions, in particular the style point evaluation, namely the objectivity of judges has been challenged. If part of the actual performance can be objectively measured with an instrument and part of the performance is based on subjective evaluation of judges, an error in ranking is possible. There are some sport species like ski jumping where both metrics are used (Krumer et al., 2020) , however, in most gymnastics the only criteria are judges’ subjective evaluation (Bučar et al., 2012; Leskoŝek et al., 2012; Rotthoff, 2014).
Reliability in measurement is consistency when under identical conditions the same results are achieved. Laboratory testing falls into this category. This might not be possible in sports since the athletes do not perform identically when they re-perform the attempt due to e.g. muscles getting weaker after the first attempt. Objectivity is defined as achieving the same result from different persons who evaluate the same performance. There are several reasons why judges may not be objective. Due to favouritism of their own ethnic group, judges might condemn less fouls against them when their race matches that of the refereeing persons in NBA (Price & Wolfers, 2010) or more penalties to soccer players of different mother tongue (Faltings et al., 2019). Judges may give more style points to their compatriots in ski jumping (Krumer et al., 2020) or figure skating (Zitzewitz, 2014). Corruption is also possible (Moriconi & de Cima, 2021; Zitzewitz, 2014).
Ranking in group gymnastics is based on the technical value of obligatory and non-obligatory movements, on artistic value of the performance and on the execution value of the performance. Hence, there are three judge groups in each competition. Typically, the judging process separates scores into a difficulty score (obligatory / nonobligatory movements) and execution scores. The difficulty scores assess the complexity of each movement a gymnast performs, and the execution score measures the performance of each movement of the group that performs the competition presentation.
The jury panel will be drawn about one or two hours before the competition, and usually each team is required to send one judge to the competition since the number of authorised judges is limited, and usually the judge is a coach of one team. Therefore, we have the potential for judges to make biased judgments. The purpose of this study is to evaluate the possible biasedness or unbiasedness of the judge panel using various group gymnastics competitions in Finland. The range of competition varies from local and rather small competitions to Finnish championship competitions where almost all potential groups are present. Along with the championship competitions there are a few important competitions that matter when the Finnish team is chosen. The judge bias is measured either with higher points to home team in relation to other judged (over-grading) or with lower points to other, usually the most important rival teams in relation to other judge evaluation (under-grading).
Judge evaluation bias – theory and evidence
If there are four judges evaluating for example technical value the extreme points, lowest and highest are truncated, the average of the two remaining is the score given to a team. In the case of three judges, no truncation is made, and the final score is the average of three evaluations. It is important to note that all judges are making their evaluation simultaneously. Below, there are two examples of evaluation with four judges if the team has made a really good performance. It is assumed that one judge represents own team (judge #1) and one represents the most important rival team (judge #4). The two remaining judges (#3 and #4) are independent. Suppose that own judge gives the highest possible points and in scenario A the rival judge does the same. In this case the final score is 5.95.
Table 2: Technical value points given by four judges when the rival judge values the performance extremely good.
Scenario B shows a case where the own judge gives the maximum points and rival judge gives a slightly lower point. The first and the latter are truncated and the final score in Scenario B is 5.9. Lower final score than in scenario A.
Table 3: Technical value points given by four judges when the rival judge values the performance rather well.
In scenario B the rival judge uses strategic voting in order to lower the final score of the team (first team with its own judge in the panel. Scenario B in relation to A shows that the dominant strategy of Judge #4 is to give the most important rival fewer points (enough lower) as this results in a lower final score for the rival. Since the judge composition is randomised for each competition, the game is played only once, however, it is possible that the teams remember strategic voting bias and during the next competition the judges are using tit-for-tat strategy. This strategy is not studied in this paper.
The data used covers all competitions in Finnish Championship series (highest level) between 2nd November 2019 and 25th September 2011 including 66 competitions and 585 performances of 31 different gymnastic associations and 152 judges. Most gymnastic associations have had teams in all three age series: 12 – 14 –year old, 14 – 16 – year old and more than 16 –year old categories. The data source is public and available from www.kisanet.fi. Some descriptive statistics of the technical values given are shown below in table 3
| Technical value max 6.0 | all age series | 12 – 14 year old #perf. 244 | 14 – 16 year olds #perf. 231 | 16-year-old #perf. 110 |
| Average (std) | 5.19 (0.65) n = 2252 | 5.18 (0.55) n = 920 | 4.98 (0.72) n = 901 | 5.67 (0.37) n = 431 |
| Final score with truncation (std) | 5.19 (0.63) n = 585 | 5.20 (0.50) n = 244 | 4.95 (0.71) n = 231 | 5.69 (0.34) n = 110 |
Table 4: Technical value, descriptive statistics, all competitions in the highest level (Finnish championship rules) between 2.11.2019 and 25.9.2021
Based on Table 3, the average technical value is higher in the senior (more than 16 year old) category, and it seems that only the best teams have continued to senior level. The number of performances (110) and evaluations (431) is only half of the performances and evaluations in the junior (14 – 16 year old) and children (12 – 14 year old) categories.
| Technical value | all age series | 12 | 14 | 16 |
| Own judge | 5.265 (0.683) n = 95 | 5.165 (0.543) n = 31 | 5.138 (0.746) n = 45 | 5.732 (0.541) n = 19 |
| The highest of the other three judges | 5.448 (0.561) | 5.445 (0.379) | 5.298 (0.651) | 5.811 (0.416) |
| paired sample t-test (own vs. highest) | -5.39*** | -3.582*** | -3.914*** | -1.662 |
| Middle of the other three judges | 5.160 (0.994) | 5.194 (0.462) | 4.916 (1.277) | 5.684 (0.614) |
| paired sample t-test (own vs. middle) | 1.338 | -0.387 | 1.420 | 1.634 |
| The lowest of the other three judges | 4.734 (1.498) | 4.439 (1.590) | 4.571 (1.578) | 5.600 (0.642) |
| paired sample t-test (own vs. lowest) | 4.277*** | 2.715* | 3.088** | 3.371** |
Table 5: Technical value given by the own judge and other judges at the highest level between 2.11.2019 and 25.9.2021
The judge himself has evaluated his own team with average points. There is no significant difference between the own assessment and the middle assessment of the other three judges. The highest points given to a team have been significantly higher than that given by own team in the children (t-test -3.582) and junior (t-test -3.914) categories. The lowest points given have been significantly lower than that of the own judge’s points. In the case of four judges, the highest and lowest points given are truncated out in the final evaluation which is the average of the two middlemost points. The technical value evaluation of the own judge is usually included in the final score.
Similar tests have been made on artistic and execution values. The results are in line with technical value. There are two teams in Finland that outperform the others, it seems that the judge of one team is using strategic underscoring in order to lower the final points of the most important rival.
Conclusions
The analysis reveals that biased judging in aesthetic group gymnastics is more than probable in domestic competitions in Finland. The own judge that evaluates the own team is not overestimating the performance in any of the three parts: technical value, artistic value, or execution value. However, it seems that the judges of the top teams strategically underestimate the performance of the most important rival. This underscoring is truncated since the highest and lowest scores are truncated in the case of four judges. The own judge scoring usually is within the two most middle scores, which is taken into account in the final score given to a performance.
The analysis used evaluations of 66 different competitions with 585 performances in a period of 22 months. All competitions were domestic, with only domestic teams and domestic judges. Many of the competitions had 12 judges: 4 evaluating technical value, 4 artistic value, and 4 execution value. All judges were drawn before the actual competition. Since there is a shortage of judges, all teams must register one judge for each competition in which their team is performing. If the team cannot register any judge, the team must pay a penalty payment to the organizer of the competition.
Football volunteering and subjective well-being
- Tim F. Thormann, Bielefeld University, tim.thormann@uni-bielefeld.de
- Pamela Wicker, Bielefeld University
- Larissa E. Davies, Sheffield Hallam University
Introduction
Volunteers play an important role in supporting and providing opportunities for participation in sports clubs. However, research suggests that the recruitment and retention of volunteers to various roles across the sport sector is challenging. This issue is particularly pertinent to grassroots football clubs, who generally experience bigger problems than clubs in other sports (Breuer et al., 2018b, Breuer & Feiler, 2020). This situation is counterintuitive to the benefits of volunteerism: Sport volunteering is often associated with a number of positive outcomes including, but not limited to, personal development (e.g., Downward & Ralston, 2006), social and human capital (e.g., Welty Peachey et al., 2015), and improved well-being (e.g., Kumnig et al., 2015; Stukas et al., 2016). In the case of subjective well-being (SWB), recent research demonstrates that not all voluntary roles necessarily generate a positive higher yield (Wicker & Downward, 2020). Moreover, different outcome measures for SWB, including both single-item measures and different multi-item scales, may show a different effect (Thormann et al., 2022).
This study investigates the causal effects of football volunteering in different roles on individuals’ SWB. It proposes two main research questions: (1) how does football volunteering affect different SWB measures? And (2) how does volunteering in different voluntary roles affect different SWB measures?
Theoretical framework and literature review
Diener et al. (2002, p. 63) define SWB as “a person’s cognitive and affective evaluations of his or her life”. These dimensions are reflected in the eudaimonic and hedonic view of SWB, which has emerged in the theoretical literature (Ryan & Deci, 2001). The eudaimonic view is associated with activities relating to personal growth and development, suggesting a closer relation to the cognitive dimension of SWB. In contrast, the hedonic view is based on happiness and the attainment of pleasure (Ryan & Deci, 2001). The literature suggests that the SWB measure of life satisfaction more closely aligns to the cognitive dimension and the eudaimonic perspective, whereas the measure of happiness more closely aligns to the emotional dimension and hedonic perspective of well-being (Peiro, 2006).
Volunteering is a heterogenous activity, and the literature suggests that the different categories of administrative, sport-related, and operational roles might yield different outcomes (Wicker & Downward, 2020). From a theoretical perspective, some sport-related activities, which involve cognitive tasks and result in personal development, such as being a committee or board member, might yield greater life satisfaction. Conversely, operational roles that support the day-to-day running of the club, but are typically less cognitively demanding, might yield lower feelings of life satisfaction, but might be associated with greater emotional aspects of well-being such as pleasure or frustration.
Methods
Data collection
The study uses quantitative data gathered from an online survey of volunteers and football club members across seven European countries (n=21,759), including England, France, Germany, Italy, Norway, Poland, and Switzerland. A standardized survey was developed in English and adapted and translated for each country, taking into account the national peculiarities of volunteering in grassroots football. The empirical data were collected between November 2020 and June 2021 yielding a convenience sample, which is similar to the approach used in previous research on football volunteers (Breuer et al., 2018ab; Emrich et al., 2014). The study uses data relating to 2019, representing the pre-Covid-19 pandemic situation.
Measures
Football volunteering is measured by the number of volunteering hours per month and role category (administrative, sport-related, or operational), based on previous research (Wicker & Downward, 2020). The study uses three measures of SWB. Two single-item measures for life satisfaction and happiness, assessed on a scale of 0-10, and a multi-item measure from the World Health Organization for comparative purposes (WHO-5 scale).
Empirical analysis
The empirical analysis consisted of two steps: (1) Descriptive statistics to give an overview of the sample structure, volunteering hours, and voluntary role categories and (2) six regression models using the three SWB measures as dependent variables. The first three models included total monthly volunteering hours as the independent variable of interest; the second three models included the monthly voluntary hours in each role category as the main independent variables. The regression models were instrumental variable (IV) estimations to investigate the potential causal effect of volunteering on SWB. The IVs stem from the volunteer function inventory scale (Clary et al., 1998) which was also assessed in the survey, providing a number of measures that are correlated with football volunteering and participation, but not with SWB. The IV models addressed the potential of reverse causality as a form of endogeneity, as used in other state-of-the-art sport volunteering research (Thormann et al., 2022; Wicker & Downward, 2020). They were estimated with the Generalized Method of Moments (GMM) estimator (Downward & Dawson, 2016; Wicker, 2020).
Results and discussion
The GMM models show that total number of volunteering hours has a significant, positive, and causal effect on the single-item measures of life satisfaction and happiness, as well as on the multi-item WHO-5 measure. This indicates that increased volunteering causes an increase in SWB. Further analysis by voluntary role category shows differential effects. Sport and operational roles both have a positive and causal effect across all three measures of SWB, whereas contrary to theoretical expectations, administrative roles only have a significant and positive causal effect on happiness, but not on the other two SWB measures. The literature suggests that the cogitative demands of administrative roles, which are more likely to be associated with the eudemonic perspective, are more likely to be impactful on the life satisfaction measure. However, this was not the case in the present study. Similarly, the expectation that operational roles associated with more pleasure would yield happiness was partly contradicted by these roles also having a significant and positive effect on the other two measures. A possible explanation is that respondents do not distinguish between the subtleties of the SWB measure as suggested in the theoretical literature (Ryan & Deci, 2011), or that the role categories examined all include some elements of cognitive achievement, personal development, and pleasure.
The study findings have implications for scholars and practitioners’ alike. For scholars undertaking future research on volunteering and SWB, the findings suggest that differentiation of volunteering by role category is perhaps more important than examining single-item or multi-item measures and eudaimonic or hedonic perspectives of SWB. For football clubs and sport governing bodies, the varying impact of different roles on SWB measures suggest that different support programs for retaining and recruiting volunteers may be required to address the cognitive and emotional aspects of different voluntary roles.
Sports popularity approached via the consumption of sports products and its effect on the country’s sports economy
- Dominika Tumová, Department of Managerial Theories, University of Žilina, Slovakia dominika.tumova@uniza.sk
- Martin Mičiak, Department of Managerial Theories, University of Žilina, Slovakia, martin.miciak@fri.uniza.sk
- Pavol Boško, Department of Managerial Theories, University of Žilina, Slovakia, pavol.bosko@fri.uniza.sk
Keywords: sports economics; sports management; popularity of sports; sports fan; sports organization.
Motivation and purpose
The main purpose of the research presented in this article was to examine and define the basic concepts necessary for the effective setting of the management of sports organizations and the entire sports industry in the country. The basic topic is the behaviour of sports fans in terms of the consumption of sports products and related merchandise. The topic is also extended by examining the relationship between the sporting achievements of teams and individuals in selected sports and their impact on the country’s economy. It contains two aspects in connection with economic manifestations – the effects on the overall economy of the country and specifically only on the sports economy.
Theoretical background
The theoretical background of the research includes the definition of the terms: spectator, consumer of a sports product, and fan. This is a necessary input for the utilization of the identified elements within a specific managerial approach – sports management. The very definition and differentiation of individual positions in connection with people’s relationship to sports is followed by an analysis of specific manifestations of sports consumer behaviour.
All the elements listed above created the basis for setting up an empirical survey based on a combination of relevant secondary sources and the collection of new primary data points in the selected country.
Empirical description
The questionnaire survey was performed from April to May 2021. Data were collected online, via Google Forms. The dissemination method applied was based on social networks (Reddit, Facebook, and others) and emails.
The questionnaire survey’s population included 4,594,153 Slovak citizens over the age of 15. There were 338 observations included in the sample. The margin of error was 5.33% (at the confidence level of 95%). This characterizes a sample that can be considered representative. The validity of the data collection tool was verified by the Cronbach alpha calculation. Its value was obtained while including the questions with Likert scale.
For the purpose of finding valid conclusions in connection with the defined intention and motivation of the research, several questions were selected. These were concerning specific manifestations of fan behaviour in connection with the willingness and frequency of purchasing the given sports product and associated merchandise.
The researched area was further analysed in more detail in relation to the similarities and differences between the individual respondents’ genders.
Main result
One of the main results concerned the sports product consumption index created in the research. It was revealed that this is statistically significantly linked to whether the respondents identify themselves as sports fans.
The authors gratefully acknowledge the contribution of the Slovak Research and Development Agency under the project APVV-20-0481: Sustainability strategy of a sports organization in the conditions of the Slovak Republic.
The Effect of an Unsuccessful Merger of eSports Live-Streaming Platforms on Content Supply
- Wenche Wang, Ph.D, Assistant Professor , Sport Management, School of Kinesiology, University of Michigan, wwenche@umich.edu
Broadcast networks compete for the rights to broadcast sport events. If these rights were non-exclusive, those networks that win the rights would further compete for viewers in the coverage and content quality (Hoehn & Lancefield, 2003). Most major sport leagues in the US and Europe have lucrative contracts that bring them substantial broadcasting revenues (Cave & Crandall, 2001; Dietl & Hasan, 2007). While some leagues, such as the UEFA Champions League and the English Premier League (EPL), sell collective (and sometimes exclusive) contracts to networks, others, such as the Spanish La Liga and the National Football League (NFL) in the US, welcome a variety of competing broadcasters. Nevertheless, most major sport games and sport events are broadcasted by a single network within a geographic location due to either the centralized marketing of media rights or the prices of the rights.
With the advent of live-streaming services, such as Amazon Prime Video, NFL Network, and YouTube TV, consumers gain access to a greater variety of games and may be able to watch a game that is not broadcasted on a local TV station. This digital shift of sport media consumption has introduced competition into the broadcast industry (Budzinski et al., 2019). Competition drives up the supply of sport, such as the coverage of games and the broadcast hours (Cave & Crandall, 2001; Quirk & Fort, 1992), which can benefit consumers (Noll, 2007). Antitrust officials have recognized the importance competition in the media market. For example, in 2006, the European Commission decided to ban exclusive broadcasting rights of the EPL in an attempt to ensure the competitiveness of the broadcasting market (European Commission, 2006). However, when new services enter the market in the form of pay-per-view or bundled packages that consumers have to pay an additional fee for, the new options may not often make consumers better off (Budzinski et al., 2019; Butler & Massey, 2019). As such, the current US antitrust law has not forbidden exclusive sport broadcasting rights.
Compared with traditional sport, eSports consumption is often conducted online through live-streaming services. Further, unlike live-streams of traditional sport, eSports live-streaming platforms, such as Twitch and YouTube Gaming, often allow viewers to watch competitive eSports matches free. (Viewers can pay a fee to upgrade to premium services to get access to advertisement-free content and other exclusive content.) There are two eSports-specific live-streaming platforms in China, Douyu and Huya. Both platforms have acquired rights to live-stream domestic leagues of popular eSports games, such as League of Legends and Honor of Kings. Another popular platform, Bilibili, also has rights to live-stream several major competitive eSports leagues. Bilibili is a general live-streaming and video sharing platform that covers a variety of video content. eSports leagues in China create their own media program for each match, with league-chosen commentators providing commentaries during the match and conducting pre-game and post-game analyses. The live-streaming platforms would therefore broadcast the same media content and viewers can decide where to watch the match.
These three live-streaming platforms also facilitate live-streaming of individual streamers and support video sharing. Streamers can discuss various topics about the games, such as conducting their own match analyses and introducing new game features. Live-streams by individual streamers constitute a large part of activities on these platforms and are perhaps even more popular than live-streams of some competitive eSports matches. On Huya for instance, the live-streaming by individual eSports-related streamers totaled 163.1 million hours in 2020, while the total hours of live-streaming competitive eSports matches was less than 8,000 hours (Huya, 2021). Streamers can generate revenue from two sources, virtual reward and selling through live-streams. Viewers can award streamers during streaming by virtual currencies, such as flowers and medals. These rewards will then be converted back to actual currencies as revenues for streamers. Streamers can also earn a percentage of the sales revenue by promoting and directly selling sponsored products during live-streams. The majority of the platform revenue comes from its royalty contracts with the streamers: in 2020, 94.5% and 92.2% of the revenues of Huya and Douyu, respectively, were attributed to revenue sharing with individual streamers (Huya, 2021; Douyu, 2021).
On October 12, 2020, Douyu and Huya announced that they would proceed with a merger. Douyu would leave the NASDAQ market and become a subsidiary of Huya. On July 10, 2021, the State Administration for Market Regulation (SAMR) in China blocked this proposed merger. During this nine-month period, both Douyu and Huya continued to operate separately and live-streamed major competitive eSports matches. However, there could be implications for individual streamers. In a two-sided market, the demand for a platform from one side of the market depends on the number of participants on the other side (Armstrong, 2006). The merger announcement could create concerns for streamers about their future. If streamers start to leave the platform, the decrease in content supply would also lead to the exit of viewers. Therefore, even if this merger was later blocked, it could still have an impact on the structure of the market.
In this paper, we examine whether this proposed merger of two competing eSports live-streaming platforms, even though unsuccessful, had any impact on the supply of both the quantity and variety of media content. Using data from Douyu, Huya, and Bilibili, we adopt a difference-in-difference approach to identify the effect of the proposed merger on content supply by comparing the “merged” period between October 12, 2020 and July 10, 2021, and the period prior to the merger, from January 11, 2020 to October 11, 2020. Our identification strategy relies on the assumption that the difference between Douyu and Bilibili has a parallel trend with the difference between Huya and Bilibili in the absence of the proposed merger. We further apply another difference-in-difference strategy to examine the effect of the SAMR’s decision to call off the merger after it was officially announced by comparing the quantity and variety of content between the “post-merger” period between July 11, 2021 and February 11, 2022, and the “merged” period.
Our study offers important implications for the eSports industry and antitrust officials. Since eSports is an emerging industry that relies heavily on digital media, the efficiency of the online media market plays a vital role in the development of eSports. Prior studies have focused on the effects of successful mergers on the product variety and market efficiency (e.g, Argentesi et al., 2021; Charpin & Piechucka, 2021); little attention has been paid to the impact of an unsuccessful merger. Mergers of platforms in a two-sided market, even if failed, may have consequences on the market structure. Traditional economics studies on media consumptions consider consumers to single-home, i.e., consumers attend to a single media platform (Anderson & Coate, 2005). In such situations, competition can result in partial unbundling and market segmentation, which ultimately results in higher consumer prices (Budzinski et al., 2019; Butler & Massey, 2019). In free-to-watch live-streaming, viewers tend to multi-home and the merger of competing platforms are likely to have anticompetitive effects (Anderson et al., 2016).
Sentiment Bias and the Futures Market in the NFL and NBA
- Mark Wilson, St. Bonaventure University, mwilson@sbu.edu
- Andrew Weinbach, Coastal Carolina University
- Charles Garrett, Syracuse University
- Rodney Paul, Syracuse University
Introduction and Background
Sentiment bias refers to systematically different returns based on factors such as popularity and recognition levels of companies. Market sentiment is the overall attitude of investors as it relates to individual assets, sectors, or the market as a whole. Prices in fnancial markets can move based upon the underlying sentiment of the majority of investors (or the majority of the dollars). Crowd psychology is an important aspect of theories based on sentiment bias and have been shown to exist in different times and markets.
Applying the definition of sentiment bias to the simple financial market that is sports wagering, sentiment bias refers to earning systematically different returns to betting on teams based upon if they are more or less well-known and/or glamorous. A few key studies investigated sentiment bias as it relates to sports betting. Avery and Chevalier (1999) was one of the first studies that investigated this form of bias. They discovered sentiment bias in the NFL and found substantial losses to what were defined as glamorous teams.
The two most relevant studies to this research as it relates to sentiment bias are the studies of Forrest and Simmons (2008) and Feddersen, et al. (2020). Forrest and Simmons (2008) investigated odds betting in the Spanish and Scottish Premier Leagues for soccer. They noted that sentiment bias is particularly important as it relates to previous findings of the reverse favorite-longshot bias in soccer wagering markets. They argue that the bias could be a result of risk-averse behavior and that it is more likely the findings stem from bettors having an emotional attachment to a team and placing bets on these most well-known teams winning matches. They used home match attendance as their proxy for the most well-known and popular teams. In their results, they found that bookmakers offered more favorable odds on clubs with large numbers of supporters. The rationale behind this, the authors note, could help with long-term retention of bettors to their sportsbooks.
Feddersen, et al. (2020) looked at sentiment bias in the point spread betting market for the NBA and NFL observing returns to the most popular teams as proxied by the difference in Facebook likes between teams. The use of social media data was a step forward in incorporating recent technology and the change in how many fans follow sports.The authors discovered that wagering strategies based on betting on the most popular teams took statistically significant losses on weekends in both sports (and in the full sample for the NFL). This was due, in their opinion, to more recreational bettors placing bets on weekends. Due to the schedule of the NBA playing nearly every night of the week, with teams playing multiple games during the week in question, is likely why the findings for this sport was only on weekends.
Sentiment Bias in Sports Wagering
This study continues the investigation into sentiment bias in sports wagering, but unlike the other studies that used individual games as their data sample, we use futures market information for the NBA and NFL. Specifically, we investigate odds of winning a championship and wins totals markets (the over/under on number of wins in a season for a team) for both sports using data spanning nearly three decades. These future market wagers offer a considerable different mindset to consider sentiment bias as these wagers take place across a full season (we consider the odds and win totals at start of season). Instead of the repetitious individual game wagering, these bets are placed in a long window, which may offer different rationales for wagering, such as a simple bias to wager on your favorite team to win a championship each season.
The two different types of futures wagers we examine are different in terms of winning and payoff structure. The future odds are the odds to win a championship in the NFL and NBA. These bets will only pay off if the team wagered upon happens to win the overall championship of the league. No payoffs are made for any other outcome. These bets tie up bettor funds for the entire length of the regular season and playoffs for these leagues. When bettors wager on this proposition, they could be using their forecasting ability or could just be wagering on their favorite team to have betting action throughout the season in question. Many stories from sportsbooks note that visitors in the offseason will often place wagers on the home team from which they visit. We therefore, will examine any bias that may occur in this marketplace.
The other form of futures wager we investigate is season win totals. Season win totals are an over/under wager placed on the number of wins a team will have in a season. These propositions are introduced into the betting marketplace in the offseason and, like championship odds, tie up money throughout the season from the bankroll of bettors. Unlike the championship odds, however, it is possible to hedge these bets, particularly near the end of the season when the betting outcome depends on the final (or last few) games. The NBA does not have ties, so all teams will have wins or losses for their full complement of games played. Although somewhat rare, ties do occur in the NFL. The season total wagers do not have any value for ties, as they do not count as a half-win or any other formulaic outcome. The wager is simply on whether the team exceeds (over) or comes up short (under) of the posted number of season wins, which is an important consideration for this marketplace.
Data and Empirical Tests
Using data on futures markets from sportsoddshistory.com, we first test the market for efficiency and then delve into the possibilities of sentiment bias influencing prices offered by bookmakers and returns to those placing bets. Odds to win the championship are typically offered with a huge sportsbook advantage in terms of payouts to winners, so this is considereed in the tests of market efficiency. Season totals are also often priced at slightly higher commission than regular sides and totals bets.
We proxy sentiment both in the manner of Forrest and Simmons (2008), using attendance, and in ways similar to Feddersen, et al. (2020), through data from social media. Social media data was gathered at the time of the study and also captured from past years using the wayback machine in terms of internet searches. Ex-ante, it is quite possible that market results could be similar to Forrest and Simmons (2008) as bookmakers may choose to offer more favorable odds on the most popular team to encourage more bets to increase volume. This is particularly the case with the odds to win a championship as the sportsbook only pays out in one instance, the team in question winning as the sole league champion. If more fans place bets on traditionally popular teams or teams that most recently won a championship, it is feasible the sportsbook could cater to these bettors to attract them to place a futures wager that is accompanied with a high expected vigorish (commission).
It is also possible that biases of those placing wagers could influence the prices offered on the most popular teams to be considerably worse. We investigate these possibilities and show the returns to different teams in these leagues over time. We also tie the results back to theories of sportsbook behavior, which has changed considerably since the original assumption of the balanced book hypothesis (where bookmakers set and move odds to equalize betting action (or proportionately attract action) on each side of the wagering proposition, to the sportsbook model suggested by Levitt (2004) in his study of a betting tournament and by Paul and Weinbach (i.e., 2008) using actual betting transactions in multiple sportsbooks.
ential returns to bettors indicate some potentially lucrative bets. For example, if the odds for the draw are between 5 and 10 at the beginning of a match (i.e., in the first 30 minutes), we observe positive returns to bettors when betting on the draw. However, since the predicted relative stake for those bets are fairly low, our results suggest that bettors do not follow that betting strategy. When looking at bets that are highly demanded by bettors — that is, betting on the draw towards the end of a match — we observe that those bets result most likely in negative returns to bettors.
Staking and Losing in Live Betting Markets: How Bookmakers Profit
- Marius Ötting, Bielefeld University
- Christian Deutscher, Bielefeld University, Christian.deutscher@uni-bielefeld.de
- James Reade, University of Reading
- Carl Singleton, University of Reading
Introduction
Bookmakers generate economically significant turnover and profits. While increasing competition has reduced bookmakers’ margins throughout the last years (Winkelmann et al., 2020), they remain highly profitable. Sportradar indicates industry turnover in 2021 at around 1.45 Trilion Euro and yearly turnover increased at around 10 percent per year throughout the last decade (Sportradar, 20221). It appears then that bookmakers must be very good at pricing / evaluating information on pre-event probabilities and within event (in-play) actions on the field to achieve such profits. Despite the magnitude of the industry, little to nothing is known about how bookmakers and bettors respond to in-game news and how their evaluation of that news leads to their financial gains and losses. We look to answer this question, by modelling when and how those gains and losses occur around moments when major in-play news breaks in betting markets.
Data
The data cover betting prices (odds) and in-game stakes placed during 612 matches of the 2017/18 and 2018/19 German Bundesliga seasons. These data were provided by a bookmaker from Europe. Since we are not allowed to use the actual values of those stakes, all stakes within each game were multiplied by an unknown constant beforehand by the bookmaker. Nonetheless, for each football matches in the sample, we can observe second-by-second relative stakes and betting odds for the whole duration that these markers were open on all potential outcomes, i.e., a win by the home team (home win), a draw (tie), or a win by the away team (away win). This temporal resolution is finer than necessary for our research questions, such that to simplify the modelling we aggregate the second-by-second stakes into intervals of one minute. This aggregation reduces the fuzziness of the data and addresses outlier stakes within single seconds.
Figure 1 shows an example time series of the prices, the relative stakes, and bookmaker’s return on investment (ROI – their percentage profit on the stakes placed) for the entire duration of an example match found in our data: FC Cologne hosting Bayer Leverkusen on 18th March 2018. The game kicked-off at 15:30h, which is when the time series begins in Figure 1. The away team, Bayer Leverkusen, was the pre-game favorite, as the blue line in the upper left panel indicates, their implied probability above 50%. The implied probabilities of a draw and FC Cologne win were around 25 percent, respectively. During the match, three major events with important implications for the final outcome of the match occurred. First, in minute 9’ (15:40h), the home team scores the first goal, indicated by the first grey dashed line. Second, the away team received a red card in minute 33’ (16:03h), leaving them undermanned and at a substantial disadvantage for the rest of the game. Finally, FC Cologne scores a second goal in minute 69’ (16:59h) for the final score of 2:0. The game was paused for fifteen minutes after the first half, as indicated by the grey shaded area in Figure 1, and ended at 17:25h. Such events had significant impacts on what the bookmaker odds implied for probabilities of the final match outcome, the betting stakes, and the bookmaker’s realized returns on the stakes being placed.
To investigate the profits made by the bookmaker during the match, we calculate the minute-by-minute returns, which are displayed for our example match in the bottom panel of Figure 1. The figure reveals that the bookmaker made profits in nearly every minute, with peaks shortly after FC Cologne scored their first goal (and still believed there was expected value in betting on Bayer Leverkusen to win the game, which eventually lost the match). More generally, in phases where the relative amount of stakes placed on Bayer Leverkusen to win is fairly large (such as during half time), we observe relatively high ROIs for the bookmaker.
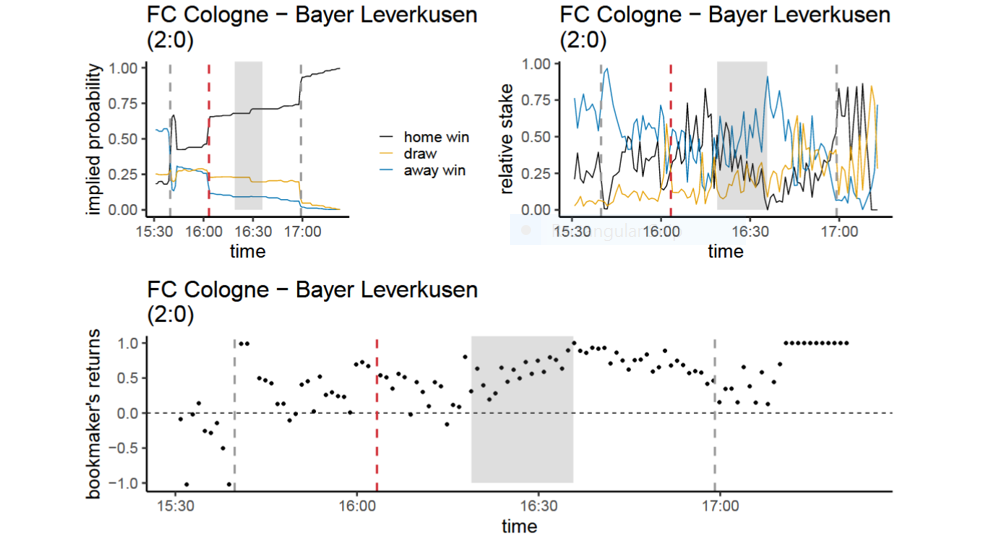
Figure 1. Top left: implied probabilities for each match outcome (home win, draw, and away win). The grey dashed lines denote goals scored, the red dashed line denotes a red card for Bayes Leverkusen, and the grey-dashed area denotes the half time. Top right: relative stakes for each match outcome. Bottom: bookmaker’s returns in each minute.
Modelling In-Play Bets
Modelling stakes placed on the team scoring the first goal
To investigate how bettors behave after the first goal is scored, we model the relative stakes placed on the team scoring the first goal — in the exploratory analysis, we have seen that betting on underdogs that score the first goal can be a promising strategy. The response variable covers the relative stakes placed on the team that scored the first goal. Since this variable is bounded between 0 and 1, we consider the following beta regression model:

where β0 represents the overall intercept, f1 and f2 are nonlinear effects of the odds after the first goal was scored and the minute of the match, and f3 captures the nonlinear interaction between odds and the current minute.
The data indicate that the relative stakes placed on the goal-scoring team tend to be fairly low for underdogs (odds larger than 3) who score a goal late in the match. Bets on favorites seem to be more demanded by bettors, as favorites (odds less than 1.5) who score an early goal attract the highest relative stakes. We can further see that bettors do not seem to take bets that are financially attractive. For bets with the highest demand, i.e., bets on favorites that score early goals, the potential returns to bettors when following this betting strategy are negative. On the other hand, betting strategies with a potential positive return to bettors — that is, placing bets on underdogs who score the first goal — do not seem to be attractive to bettors, as the relative stake for these bets is predicted to be between 0.2 and 0.4.
Modelling stakes placed on the team scoring the draw
Similar to the analysis of the stakes placed on the goal-scoring team to win, we have seen that substantial profits can be made when betting on the draw if the favorite scores first. To investigate bettors’ behavior in terms of stakes placed on the draw, we consider the same beta regression model shown in Eq. (1), but now with the relative stakes placed on the draw as response variable. The potential returns to bettors indicate some potentially lucrative bets. For example, if the odds for the draw are between 5 and 10 at the beginning of a match (i.e., in the first 30 minutes), we observe positive returns to bettors when betting on the draw. However, since the predicted relative stake for those bets are fairly low, our results suggest that bettors do not follow that betting strategy. When looking at bets that are highly demanded by bettors — that is, betting on the draw towards the end of a match — we observe that those bets result most likely in negative returns to bettors.