This page gathers the extended abstracts from Topic 1 of the Compass Conference: Transferable Skills for Research & Innovation, 2023, October 4 – 5, Helsinki, Finland.
Application of circularity tools for evaluation the sustainability of urbanization process (case study; city of Seville)
Nadia (Falah), N.F.
Corresponding author – presenter
Nadfal@alum.us.es, University of Seville, Spain
Jaime (Solís-Guzmán), J.S.G.
University of Seville, Spain
Keywords: Circularity, Circular Economy (CE), Sustainable development, Urbanization, Strategic Environmental Assessment (SEA)

The urbanization process is one of the most important complex issues that promote rapid social and economic development in major cities and metropolises as a result of conflict with the natural environment (Papageorgiou et al., 2021). Urban growth and development lead a range of social, economic and environmental issues (Falah et al., 2020). Therefore, it is necessary to pay attention to the development process of the city and coordinate it with the components of sustainable development (Vinante et al., 2021) , given that understanding the process and pattern of urban growth and anticipating future changes is essential to achieving sustainable urban development (Taravat et al., 2017). Therefore, evaluation the process of urbanization should appear in harmony with some areas such as sustainability (Gravagnuolo et al., n.d.-a). It is important to create models that can simulate the process of urbanization (Wang et al., 2020), and evaluate the amount of sustainability of the cities. For this model it is necessary to recognizing innovation and practical indicators for evaluation sustainability. The important point about circularity tools is following the aims and goals of sustainability (Corona et al., 2019) but with the more innovation point of closing loop of development. Also, it is necessary to recognize the patterns of development and apply it to the urban evaluation sustainability (Parchomenko et al., 2019a). This integration between circularity tools (for selecting related indicators and framework) and innovation evaluation systems (for evaluation the amount of sustainability) will introduce more balanced view of the entire urban planning process and it will make easier to achieve the goals of sustainable urban development (Saidani et al., 2019b). Based on the concepts of evaluation between city’s process conditions and amount of sustainability (Williams, 2022), circular indicators and temporal techniques are implemented for monitoring and evaluation urban development and evaluate the future of the city based on different alternatives by using strategic environmental assessment (SEA) (Geissdoerfer et al., 2017). The main question of this work is; How can mixed Strategic sustainability and an innovation and comprehensive indicators based on circularity for evaluation, monitoring and predicting the condition of city’s processing?
Literature review
Circularity and sustainability are two concepts that have gained significant attention in recent years (Niyommaneerat et al., 2023)due to their potential to address pressing global challenges such as climate change, resource depletion, and environmental degradation (Daglis et al., 2023). While both concepts share some similarities in terms of their focus on reducing environmental impact (BoteAlonso et al., 2022), there are also some key differences between circularity and sustainability in terms of their aims and goals(de Oliveira & Oliveira, 2023)
The sustainable development as a modern approach was introduced as a solution for the developmentissue in the world (Moraga et al., 2019). The sustainable development consists of three dimensions, i.e., economic development, environmental protection, and social equity (Vinante et al., 2021) . The importance of sustainable development is obvious but selecting criteria and indicators for evaluation sustainability can be as the most important tool and direct trend towards sustainability (Nikolaou etal., 2021), which in the most of previous researches are used some specific and fix indicators based on linear frameworks from previous experiences and research backgrounds (Saidani et al., 2019b). But circularity offers a novel pathway to sustainable development as a driver for sustainability(García-Barragán et al., 2019). Therefore, sustainability assessment should adapt to the new circularity paradigm (Calisto Friant et al., 2023). Circularity contributes to a more sustainable, but not all sustainability initiatives contribute to circularity. Circularity and sustainability stand in a long tradition of related visions, models and theories (Suárez-Eiroa et al., 2019). The need to clarify ‘sustainability’ and ‘circular economy’ (CE) and their interrelationship has been increasing (Barreiro-Gen & Lozano, 2020). Circularity, especially circular economics is a way of implementing the Sustainable Development Goals (SDGs)(Kirchherr et al., 2023), This relation is statistically significant between some indicators of the CE and SDGs and between some indicators of the CE and the average value of the fulfillment of SDGs (Suárez-Eiroa et al., 2019). the circular economy is increasingly considered not only in the context of industrial transformations, but also as a promising pathway to achieve sustainable urban development (Chen,2021). framework of CE consists of three separate levels (Kirchherr et al., 2017),the micro system(e.g., circular business model, circularity of product, circular consumption ) perspective often considers products, individual companies, and what needs to happen to increase their circularity as consumers as well, the mesosystems (e.g., industrial ecology, industrial symbiosis and eco- clusters)perspective generally focuses on eco-industrial parks as systems and this level is also called the “regional level” sometimes, and the macrosystems (e.g., city, region, nation and beyond, circular economy policy tools) (Nikolaou et al., 2021).
It is obvious the most of the experiences of using circularity frameworks back to the scale of micro and me so and it is increasingly important to map CE frameworks that can be applied at the scale of city (Williams, 2022) and measure the level of circularity in cities (Kristensen & Mosgaard, 2020). There are only a few studies that focus on indicators for measuring circularity at the level of city (Calisto Friant et al., 2023).
On the other hand, urban expansion is a multifaced phenomenon(Hosseini & Hajilou, 2018) that involving adverse changes in land use and land cover (LULC)(Wang et al., 2020). Accelerated urbanization process have increased the pressure on the natural environment (Taravat et al., 2017). Sustainable urban development as a dynamic process (Kristensen & Mosgaard, 2020) consists tomaintain the balance among the “Triple Bottom Lines” of sustainability (economic, environmental,and social), promote the urbanization process, and minimize the environmental impacts (Papageorgiou et al., 2021). Therefore, based on definition of urbanization process, sustainable urbanization targets can be used to assess sustainable development (Vinante et al., 2021) and based on related between circularity and sustainability, the outcomes of the circularity frameworks are proposed as a starting point for a specific framework for the evaluation of urbanization processes (Papageorgiou et al., 2021). That framework could be useful to have a comprehensive view for achieving circularity and sustainability targets. Therefore, three main lines must be studied; 1. circularity, 2. sustainability and 3. urbanization that each of them included especial keywords and steps of studies and them relation between them must be evaluated.
Aim of the study
Developing a methodology to integrate environmental, economic and social indicators based on circular framework (circularity goals moving in line with the Sustainable Development Goals) and adaptability of the urbanization process with circularity tools is an innovative idea presents practical and constructive solutions to promote the development situation of different city. Therefore, the main goal of this thesis is: introduce, develop and design a comprehensive methodology for Strategic Evaluation of urbanization sustainability based on circularity indicators and predicting the future of sustainability in the scale of city.
Methodology
The methodology will be based on the mixed approach (descriptive and analytic) with one specific goal,” evaluation condition of sustainability”. Some researchers have used just mathematical and statistical models for analyzing and predicting urban development sustainability. Their aims are to detect and monitor temporal and spatial variations in the urban expansion and land cover land use change (LULC) by using remote sensing technology, change detection technique and geographic information system (GIS).
In this study in one way, by using remote sensing process (Landsat satellite images, spatial and temporal dynamics and indicators of change detection) will be evaluate the amount, process and type of detection in LULC (infill or sprawl) during the past 20 years that the result of this step will be some maps that will show the process and amount of changing in city. Also, on the other hand, focus on recognizing different circularity tools and classification and normalization criteria and indexes which are related to the sustainability and by selecting a/some methodology/s (such as FANP), amount of sustainability will be evaluate (for compare the trend of urbanization and the sustainability of the process). Then the trend of urbanization and sustainability in scale of city in different contexts and situations can be compared based on the sustainability dimensions factors, selected indicators of circularity and results of remote sensing.
There are some limitations to access to the data and information (access to plans and projects of the city, up-to-date document, maps and satellite images). Therefore, it is must to make a correlationbetween indexes and available documents and also normalize different quantitative and qualitative indicators. Based on the main goal, some multifaced methods will be used (remote sensing and MCDM (Multiple Criteria Decision Making)), for comparing them, it is necessary to introduce methods for overlapping and normalize these maps to the one specific map. For example, for overlapping data and basement maps; using GIS, for analyzing and evaluation different trend and amount of sustainability; using techniques such as SPSS regressions, Delphi model, SWOT and PEST analysis at the end by using different strategic evaluation systems (such as SEA) the future trend of city will be predicted and some alternatives for achieving more sustainable city in order to circular indicators and strategic point of view in 2032 will be introduced.
As a case study, decided to apply to city of Seville (Spain) because Seville always committed to all actions related to sustainable development; such as Agenda 21, Agenda 2030 and the sustainable development goals (SDG). Also, following GAUS (guide for a more sustainable architecture and urbanism), which makes it as a suitable case study to experiment, evaluate and monitor future trend of circularity and sustainability.
Expected results
The main expected results and achievements will be as following;
- Understanding about the degree of applicability of circularity indicators in the scale of city.
- Introducing a mixed innovation strategic view based on circularity and sustainability.
- Designing a scientific link between circularity and urbanization process for achieving
- sustainable development in the city of Seville.
- Knowledge about the trend, level and amount of sustainability in the city of Seville for a period of 20 years from 2002 to 2022.
- Comparing the different types of urbanization process in Seville city from 2002 to 2022 and define urban circularity in case study.
- Having a sustainable model to monitor and predict the process of the sustainable development.
References
Barreiro-Gen, M., & Lozano, R. (2020). How circular is the circular economy? Analysing the implementation of circular economy in organisations. Business Strategy and the Environment, 29(8), 3484–3494. https://doi.org/10.1002/bse.2590
Bote Alonso, I., Sánchez-Rivero, M. V., & Montalbán Pozas, B. (2022). Mapping sustainability and circular economy in cities: Methodological framework from europe to the Spanish case. Journal of Cleaner Production, 357. https://doi.org/10.1016/j.jclepro.2022.131870
Calisto Friant, M., Vermeulen, W. J. V., & Salomone, R. (2023). Transition to a Sustainable Circular Society: More than Just Resource Efficiency. Circular Economy and Sustainability. https://doi.org/10.1007/s43615-023-00272-3
Chen, C. W. (2021). Clarifying rebound effects of the circular economy in the context of sustainable cities. Sustainable Cities and Society, 66, 102622. https://doi.org/10.1016/J.SCS.2020.102622
Corona, B., Shen, L., Reike, D., Rosales Carreón, J., & Worrell, E. (2019). Towards sustainable development through the circular economy—A review and critical assessment on current circularity metrics. Resources, Conservation and Recycling, 151, 104498. https://doi.org/10.1016/J.RESCONREC.2019.104498
Daglis, T., Tsironis, G., & Tsagarakis, K. P. (2023). Data mining techniques for the investigation of the circular economy and sustainability relationship. Resources,
Conservation and Recycling Advances, 19. https://doi.org/10.1016/j.rcradv.2023.200151
de Oliveira, C. T., & Oliveira, G. G. A. (2023). What Circular economy indicators really measure? Anoverview of circular economy principles and sustainable development goals. Resources, Conservation and Recycling, 190. https://doi.org/10.1016/j.resconrec.2022.106850
Falah, N., Karimi, A., & Harandi, A. T. (2020). Urban growth modeling using cellular automata model and AHP (case study: Qazvin city). Modeling Earth Systems and Environment, 6(1). https://doi.org/10.1007/s40808-019-00674-z
Fusco Girard, L., & Nocca, F. (n.d.-a). Moving Towards the Circular Economy/City Model: Which Tools for Operationalizing This Model? https://doi.org/10.3390/su11226253
Fusco Girard, L., & Nocca, F. (n.d.-b). Moving Towards the Circular Economy/City Model: Which Tools for Operationalizing This Model? https://doi.org/10.3390/su11226253
García-Barragán, J. F., Eyckmans, J., & Rousseau, S. (2019). Defining and Measuring the Circular Economy: A Mathematical Approach. Ecological Economics, 157, 369–372.https://doi.org/10.1016/J.ECOLECON.2018.12.003
Geissdoerfer, M., Savaget, P., Bocken, N. M. P., & Hultink, E. J. (2017). The Circular Economy – Anew sustainability paradigm? In Journal of Cleaner Production (Vol. 143, pp. 757–768). Elsevier Ltd. https://doi.org/10.1016/j.jclepro.2016.12.048
Gravagnuolo, A., Angrisano, M., & Girard, L. F. (n.d.-a). Circular Economy Strategies in EightHistoric Port Cities: Criteria and Indicators Towards a Circular City Assessment Framework. https://doi.org/10.3390/su11133512
Gravagnuolo, A., Angrisano, M., & Girard, L. F. (n.d.-b). Circular Economy Strategies in EightHistoric Port Cities: Criteria and Indicators Towards a Circular City Assessment Framework. https://doi.org/10.3390/su11133512
Hosseini, S. H., & Hajilou, M. (2018). Drivers of urban sprawl in urban areas of Iran. https://doi.org/10.1111/pirs.12381
Kirchherr, J., Reike, D., & Hekkert, M. (2017). Conceptualizing the circular economy: An analysis of 114 definitions. Resources, Conservation and Recycling, 127, 221–232. https://doi.org/10.1016/J.RESCONREC.2017.09.005
Kirchherr, J., Yang, N. H. N., Schulze-Spüntrup, F., Heerink, M. J., & Hartley, K. (2023). Conceptualizing the Circular Economy (Revisited): An Analysis of 221 Definitions. In Resources, Conservation and Recycling (Vol. 194). Elsevier B.V. https://doi.org/10.1016/j.resconrec.2023.107001
Kristensen, H. S., & Mosgaard, M. A. (2020). A review of micro level indicators for a circular economy – moving away from the three dimensions of sustainability? Journal of Cleaner Production, 243, 118531. https://doi.org/10.1016/J.JCLEPRO.2019.118531
Linder, M., & Williander, M. (2015). Circular Business Model Innovation: Inherent Uncertainties. https://doi.org/10.1002/bse.1906
Moraga, G., Huysveld, S., Mathieux, F., Blengini, G. A., Alaerts, L., Van Acker, K., de Meester, S., &Dewulf, J. (2019). Circular economy indicators: What do they measure? Resources, Conservation and Recycling, 146, 452–461. https://doi.org/10.1016/J.RESCONREC.2019.03.045
Nikolaou, I. E., Jones, N., & Stefanakis, A. (2021). Circular Economy and Sustainability: the Past, the Present and the Future Directions. Circular Economy and Sustainability, 1(1), 1–20. https://doi.org/10.1007/s43615-021-00030-3
Niyommaneerat, W., Suwanteep, K., & Chavalparit, O. (2023). Sustainability indicators to achieve a circular economy: A case study of renewable energy and plastic waste recycling corporate socialresponsibility (CSR) projects in Thailand. Journal of Cleaner Production, 391. https://doi.org/10.1016/j.jclepro.2023.136203
Papageorgiou, A., Henrysson, M., Nuur, C., Sinha, R., Sundberg, C., & Vanhuyse, F. (2021).
Mapping and assessing indicator-based frameworks for monitoring circular economy development at the city-level. Sustainable Cities and Society, 75. https://doi.org/10.1016/j.scs.2021.103378
Parchomenko, A., Nelen, D., Gillabel, J., & Rechberger, H. (2019a). Measuring the circular economy – A Multiple Correspondence Analysis of 63 metrics. Journal of Cleaner Production, 210, 200–216. https://doi.org/10.1016/J.JCLEPRO.2018.10.357
Parchomenko, A., Nelen, D., Gillabel, J., & Rechberger, H. (2019b). Measuring the circular economy – A Multiple Correspondence Analysis of 63 metrics. Journal of Cleaner Production, 210, 200–216. https://doi.org/10.1016/J.JCLEPRO.2018.10.357
Saidani, M., Yannou, B., Leroy, Y., Cluzel, F., & Kendall, A. (2019a). A taxonomy of circular economy indicators. Journal of Cleaner Production, 207, 542–559. https://doi.org/10.1016/J.JCLEPRO.2018.10.014
Saidani, M., Yannou, B., Leroy, Y., Cluzel, F., & Kendall, A. (2019b). A taxonomy of circular economy indicators. Journal of Cleaner Production, 207, 542–559. https://doi.org/10.1016/J.JCLEPRO.2018.10.014
Suárez-Eiroa, B., Fernández, E., Méndez-Martínez, G., & Soto-Oñate, D. (2019). Operational principles of circular economy for sustainable development: Linking theory and practice. Journal of Cleaner Production, 214, 952–961. https://doi.org/10.1016/J.JCLEPRO.2018.12.271
Tapia, C., Randall, L., Wang, S., & Aguiar Borges, L. (2021). Monitoring the contribution of urban agriculture to urban sustainability: an indicator-based framework. Sustainable Cities and Society, 74, 103130. https://doi.org/10.1016/J.SCS.2021.103130
Taravat, A., Rajaei, M., & Emadodin, I. (2017). Urbanization dynamics of Tehran city (1975- 2015) using artificial neural networks. Journal of Maps, 13(1), 24–30. https://doi.org/10.1080/17445647.2017.1305300
Vinante, C., Sacco, P., Orzes, G., & Borgianni, Y. (2021). Circular economy metrics: Literaturereview and company-level classification framework. Journal of Cleaner Production, 288, 125090. https://doi.org/10.1016/J.JCLEPRO.2020.125090
Wang, S., Jiao, X., Wang, L., Gong, A., Sang, H., Salahou, M. K., & Zhang, L. (2020).
Integration of boosted regression trees and cellular automata-markov model to predict the land use spatial pattern in Hotan Oasis. Sustainability (Switzerland), 12(4). https://doi.org/10.3390/su12041396
Williams, J. (2022). Challenges to implementing circular development–lessons from London.
International Journal of Urban Sustainable Development, 14(1), 287–303. https://doi.org/10.1080/19463138.2022.2103822
Building Information Modelling and Advanced Technologies in Life Cycle Assessment of Refurbishment of Buildings in Spain
Gachkar, S.
Corresponding author – presenter
sadgac@alum.us.es; Universidad de Sevilla, Spain
I am grateful to my advisors Antonio Garcia Martinez and Cecilio Angulo Bahón for their invaluable support.
Keywords: Global warming, Building refurbishment, Life Cycle Assessment, AdvancedTechnologies, Digital Twins, Artificial Intelligence, Energy consumption, CO2 emissions.

The phenomenon of global warming poses a significant challenge worldwide, with buildings accounting for nearly 40% of final energy consumption and approximately 35–50% of CO2 emissions, making them a key focus in the European Strategy for Energy and Climate Change. To address this issue, this study aims to identify the refurbishment strategy with the lowest environmental impact using Life Cycle Assessment (LCA) and assess the best solution for enhancing the thermal resistance of buildings while minimizing CO2 emissions. The research also explores the integration of advanced technologies, such as Digital Twins (DT) and Artificial Intelligence (AI) algorithms, to support sustainable construction and decision-making processes.
Buildings play a significant role in contributing to global energy consumption and CO2 emissions. Extensive research efforts by the International Energy Agency (IEA) and the European Commission (EC) have emphasized the need to reduce energy consumption and CO2 emissions from buildings, aiming for an 80% reduction in global emissions by 2050. Housing refurbishment could be classified under two major approaches such as the measure approach and the whole‐house approach. The measure approach focuses on the installation of an individual refurbishment measure such as cavity wall insulation, loft insulation and double-glazing installation. In contrast, the whole‐house approach considers all the potential refurbishment measures holistically, including the fabric, the services and renewable energy systems (Kim, 2015). In the pursuit of more sustainable building practices, life cycle assessment (LCA) is recognized as a key method for investigating the potential environmental impacts of materials, products, systems, or the entire building (Thibodeau et al., 2019). Regarding rehabilitated building LCA, the literature review have been established. Itard & Klunder, 2007 have examined different life cycle aspects of two post-war residential blocks in the Netherlands. The study applied four different scenarios on each building: simple maintenance, envelope refurbishment, extensive intervention and replacement. Though the study does not explain how calculations have been made, both case studies showed that replacement was the worst option, while envelope refurbishment and extensive intervention were the best. Erlandsson & Levin, 2004 have evaluated the national-scale impact of refurbishments and new buildings in Sweden and presented a detailed analysis of a single case study complex over 30 years. The study concluded that refurbishments had reached better life cycle energy performance. It is hard to understand from the study, however, how the new building was designed, and which energy – performance measures were implemented in it.
Alba-Rodríguez et al., 2017 have examined the refurbishment of an existing residential block in Seville, Spain, and compared it with its replacement. The building had suffered damages during its construction and was therefore assessed for its refurbishment or replacement. The analysis showed that even in the case of a severely damaged building, the refurbishment alternative resulted with a better environmental and economic impacts. Gaspar & Santos, 2015 have compared the extensive refurbishment and the replacement of a single-family house in Portugal. Both the refurbishment and the new building in the study were the same (i.e., though it was possible to improve the design in the newbuilt option, this has not been done). As the only difference between the two alternatives was their embodied energy (which was far greater in the replacement alternative), the expected conclusion was that the new building had higher overall energy consumption.
Furthermore, in this literature review studies be found that aim at determining if, from a life cycle perspective, it is environmentally better to rehabilitate than to demolish and rebuild.
Meijer & Kara, 2012 conclude that the expected building service life and the operational energy after rehabilitation determine the decision to either rehabilitate or rebuild the building regarding environmental performance. Hence, when the building service life is longer than 30 years and the operational energy savings obtained with a new building are high compared to rehabilitation scenarios, the new building scenario is the best option; otherwise rehabilitation scenarios are preferable. Weiler et al., 2017 show that the refurbished building achieving the highest energy efficiency standard results in the lowest life cycle energy consumption and greenhouse gas emissions when compared with a less ambitiously refurbished building or a new building meeting current standards. De Angelis et al., 2013 show that the rehabilitation option is preferable to the new building scenario, since the new building suffers from the rebuilding phase, which accounts for 35–40% of its life cycle potential impacts.
According to this background, the integration of energy assessment and environmental analysis of insulation materials can represent an added value in the refurbishment process of buildings. Against this background, the present paper represents a further investigation of advanced technologies, such as Digital Twins (DT) and Artificial Intelligence (AI) algorithms, which adds novelty to the field of sustainable construction and decision-making processes. Aim of this study is to address the environmental impact of building refurbishment in Spain by using Life Cycle Assessment (LCA) as a tool to evaluate different strategies and integration of LCA with advanced technologies. The primary goal is to identify the refurbishment approach that achieves the lowest environmental impact while simultaneously enhancing thermal resistance and minimizing CO2 emissions.
This research method is quantitative and adopts a case study (buildings of Polígono San Pablo inSevilla) that performs a environmental assessment of insulated materials in different parts of residential buildings of neighborhood in Spain for high thermal resistance and low-Co2. To simulate the building, the BIM tool is used to formulate LCA refurbishment alternatives. In the first phase, the study measuresthe current carbon emissions and energy consumption of selected buildings in Polígono San Pablo, Sevilla. Data collection involves conducting energy audits and gathering information on the existing building conditions. Subsequently, the impact of different insulating materials for whole-house refurbishment is assessed, examining their influence on CO2 emissions and energy use. This study intends to achieve the objectives of the research by conducting three phases. In the first phase, the current carbon emissions and energy use of selected buildings in Spain are measured. Then, in the second phase, the impact of different insulating materials for whole-house refurbishment in selected buildings are presented and the impact of each of them on CO2 emissions and energy use is examined. This is achieved by developing a methodology for incorporating BIM and DT based Life CycleAssessment (LCA) to calculate highly detailed material quantities. Data collected via DT can be used to record and evaluate the existing state of the buildings, which informs appropriate decisions on whether the building needs to be repaired, simply maintained, or retrofitted. Finally, buildings will be restored with the approach of minimum CO2 emissions and energy consumption. Furthermore, in this study integration of AI technology in relation to BIM and DT will be used. Artificial intelligence (AI) is a pre-programmed system that caters to individual users’ preferences for various services in various contexts. It allows us to change the temperature, humidity, lighting, ventilation speed and electrically controlled. The concept of AI is offered as a smart controller with a broader data collection system and a multi-appliance control interface.
To accomplish this, a comprehensive methodology is developed to utilize Building Information Modelling (BIM) LCA tools, enabling the calculation of highly detailed material quantities and environmental impacts. The findings of this study contribute to the advancement of sustainable building refurbishment practices and emphasize the significance of integrating advanced technologies. Through the analysis of different refurbishment scenarios using BIM LCA tools and AI algorithms, the study identifies the most sustainable options during the strategic phase. The results demonstrate the potential of advanced technologies and Life Cycle Assessment (LCA) in guiding sustainable building refurbishment processes, enabling informed decision- making and improved environmental performance.
The study conducted a detailed assessment of building refurbishment strategies in the Polígono SanPablo area, Sevilla, Spain, using Life Cycle Assessment (LCA) methodology and advanced technologies. The following specific findings were obtained:
- Current carbon emissions and energy use: The study measured the carbon emissions and energy consumption of selected buildings in Polígono San Pablo. The analysis revealed significant variations in energy performance and CO2 emissions among the buildings, highlighting the potential for improvement through refurbishment.
- Impact of insulating materials: The research evaluated the environmental impact of different insulating materials used in whole-house refurbishment. The findings demonstrated that the choice of insulation material significantly influenced CO2 emissions and energy use. Materials with higher thermal resistance resulted in reduced energy consumption and lower carbon emissions throughout the building’s life cycle.
- Integration of advanced technologies: The study explored the integration of Digital Twins (DT) and Artificial Intelligence (AI) algorithms to support sustainable construction and decision- making processes. The findings showcased the potential of DT technology to capture real-time building conditions and enable efficient building operation. AI algorithms demonstrated their capability to identify correlations within large datasets, facilitating the identification of functional connections between input and output variables.
- Environmental performance optimization: By utilizing BIM LCA tools, the research enabled the analysis of different refurbishment scenarios. The findings emphasized the importance of considering the entire life cycle of buildings to achieve optimal environmental performance. The study identified strategies that reduced energy consumption and minimized CO2 emissions, contributing to the overall sustainability of building refurbishment projects.
The obtained results provide evidence for the effectiveness of integrating advanced technologies, such as DT and AI algorithms, with LCA methodology in guiding sustainable building refurbishment processes. These findings support decision-making in sustainable construction practices and highlight the potential for significant environmental improvements in the Polígono San Pablo area.
In conclusion, this study highlights the potential of advanced technologies and Life Cycle Assessment(LCA) in guiding sustainable building refurbishment processes. The integration of Building Information Modelling (BIM) tools, Digital Twins (DT), and AI algorithms offers valuable support for decision-making in sustainable construction practices. The managerial implications suggest the adoption of these tools to enhance the environmental performance of building refurbishment projects. However, limitations exist, including the need for further validation of the proposed methodology and the specific applicability of the findings to the Polígono San Pablo context.
References
Alba-Rodríguez, M. D., Martínez-Rocamora, A., González-Vallejo, P., Ferreira-Sánchez, A., & Marrero, M. (2017). Building rehabilitation versus demolition and new construction: Economic and environmental assessment. Environmental Impact Assessment Review, 66, 115–126.
DE ANGELIS, E., DOTELLI, G., LA TORRE, A., PANSA, G., PITTAU, F., PORCINO, C. F., & VILLA, N. (2013). LCA and LCC based energy optimization of building renovation strategies. Proceedings of the InternationalSustainable Building Conference, Graz University of Technology, Austria, 25-28 Sept, 2013, 77–86.
Erlandsson, M., & Levin, P. (2004). Environmental assessment of rebuilding and possible performance improvements effect on a national scale. Building and Environment, 39(12), 1453–1465.
Gaspar, P. L., & Santos, A. L. (2015). Embodied energy on refurbishment vs. demolition: A southern Europe case study. Energy and Buildings, 87, 386–394.
International Energy Agency (IEA) Renewables-Fuels & Technologies. Available online: https://www.iea.org/fuels-and-technologies/renewables (accessed on 6 October 2020).
Itard, L., & Klunder, G. (2007). Comparing environmental impacts of renovated housing stock with new construction. Building Research & Information, 35(3), 252–267.
Kim, K. (2015). Conceptual Building Information Modelling framework for whole‐house refurbishment based on LCC and LCA. Aston University.
Meijer, A., & Kara, E. C. (2012). Renovation or rebuild? An LCA case study of three types of houses.
Proceedings of 1st International Conference on Building Sustainability Assessment, 595–602.
Thibodeau, C., Bataille, A., & Sié, M. (2019). Building rehabilitation life cycle assessment methodology–state of the art. Renewable and Sustainable Energy Reviews, 103, 408–422.
Weiler, V., Harter, H., & Eicker, U. (2017). Life cycle assessment of buildings and city quarters comparing demolition and reconstruction with refurbishment. Energy and Buildings, 134, 319–328.
Final electricity demand: understanding the behaviour of the Spanish large consumers for their incorporation to the energy transition
Dorado Galatoire, E.A.
Corresponding author – presenter
doradogalatoire@gmail.com; University of Seville, Spain
Keywords: final electricity demand, Spanish large consumers, energy transition.

Abstract
This paper recognizes that it is necessary adding flexibility on the part of end consumers to achieve the energy transition, controlling fluctuations in intermittent renewable sources, and improving the physical operation of the electricity grid. To understand the behaviour of the Spanish final electricity demand, annual energy balance data and sectoral evolution of electricity demand by large consumers data, for the interval of time between 2010 and 2021, have been used. The results show that the high participation of the large consumers on the total final electricity demand in Spain, gives signals to encourage them for the development of flexibility resources. Knowing the behaviour of the electricity demand of the different Spanish economic sectors, it is possible to choose the best flexibility attributes that can be incorporated into the electricity system.
Introduction
Previous research suggests that demand side flexibility (DSF) can help offset fluctuations in intermittent renewable generation, with smart management of large consumers or aggregators
of smaller consumers who are willing to voluntary modulate their consumption and even stop consuming in the face of energy shortages (PwC España et al., 2021). According to (Milligan et al., 2016) there are two potential market structures that can incentivize the investment of these new flexibility resources, and both focus on long term investments: first, markets can provide incentives for the market entry of new resources that have necessary flexibility attributes; second, markets can provide incentives for existing resources to increase their ability to offer flexibility, subject to technical barriers and economic trade-offs.
Complementing the previous papers, (DNV & ACER, 2021) indicate that the participation of new and smaller players without relevant experience in the electricity sector is restricted by their size and cannot enjoy economies of scale despite having a reasonable business model, which makes it necessary to search for a business model different from the one established in the wholesale market, such as adding flexibility on the part of end consumers, offering new services that are different from the traditional ones. (Cochran et al., 2013) affirm that the current regulatory structures are the major barriers to increase the potential for demand side flexibility, reflecting a traditional demarcation between wholesale electricity markets and retail markets, causing lack of incentive for demand side flexibility.
The objectives of this paper are to analyse the electricity demand behaviour of the different Spanish economic sectors; to analyse the electricity demand behaviour of the Spanish large consumers; and to compare both groups studied.
The paper is structured as follows. Section 2 provides some relevant notes on the current situation of final electricity demand in Spain. Section 3 describes the methodology for calculating the electricity demand of Spanish large consumers. Section 4 presents the results achieved. Finally, section 5 offers the main conclusions and future lines of research.
Final electricity demand in Spain. Current situation.
The Ministry for Ecological Transition and Demographic Challenge (MITERD) provide reliable information on the energy situation in Spain through the annual energy balance report. This statistical operation meets the information demands of both national and international organizations (EUROSTAT, IEA, United Nations) (MITERD, 2022).
Table 1 shows the behaviour of the final electricity demand in Spain, from 2010 to 2021.
Table 1. Final electricity demand in Spain. 2010-2021.
| Electricity demand sectors (GWh) | 2010 | Period from 2010 to 2021 | 2021 | ||
| Average | Minimum | Maximum | |||
| Industrial sector | 73 490 | 74 682 | 68 884 | 81 019 | 75 844 |
| Iron and steel | 14 318 | 13 135 | 10 909 | 15 136 | 12 135 |
| Chemical and petrochemical | 8 638 | 9 178 | 8 410 | 9 877 | 9 877 |
| Non-ferrous metals | 8 652 | 9 022 | 6 995 | 10 728 | 6 995 |
| Non-metallic minerals | 7 699 | 6 294 | 5 494 | 7 699 | 7 148 |
| Transportation equipment | 2 851 | 3 634 | 2 657 | 4 499 | 4 065 |
| Machinery | 3 826 | 4 665 | 3 746 | 5 281 | 4 992 |
| Extractives industries | 1 211 | 1 663 | 1 211 | 2 251 | 1 770 |
| Food, beverages, and tobacco | 10 472 | 10 347 | 9 322 | 11 273 | 11 273 |
| Pulp, paper, and graphic arts | 3 959 | 5 525 | 3 959 | 6 073 | 6 073 |
| Wood and wood products | 1 415 | 1 386 | 1 089 | 1 691 | 1 691 |
| Construction | 2 162 | 2 614 | 1 924 | 3 958 | 3 958 |
| Textile and leather products | 2 162 | 1 796 | 1 329 | 2 162 | 1 329 |
| Not elsewhere specified – industry | 5 521 | 5 372 | 3 562 | 7 026 | 4 537 |
| Transport sector | 3 222 | 3 808 | 3 222 | 4 046 | 3 662 |
| Rail | 3 061 | 3 469 | 2 922 | 3 729 | 3 088 |
| Road | – | 83 | – | 350 | 350 |
| Domestic aviation | – | – | – | – | – |
| Domestic navigation | – | – | – | – | – |
| Pipeline transport | – | 222 | – | 280 | 199 |
| Not elsewhere specified – transport | 160 | 34 | 20 | 160 | 24 |
| Other sectors | 168 090 | 155 654 | 147 435 | 168 090 | 148 374 |
| Commerce and public services | 83 892 | 75 137 | 67 233 | 83 892 | 69 137 |
| Households | 75 679 | 72 843 | 69 648 | 76 107 | 73 149 |
| Agriculture / forestry | 4 150 | 5 062 | 4 004 | 5 984 | 5 630 |
| Fishing | – | 30 | – | 133 | 133 |
| Not elsewhere specified – other | 4 371 | 2 582 | 324 | 4 895 | 324 |
| TOTAL | 244 802 | 234 144 | 219 655 | 244 802 | 227 881 |
| Total demand at generation busbars (REE) | 275 814 | 263 875 | 250 051 | 275 814 | 256 546 |
Methodology
The System Operator (SO), Red Eléctrica España, periodically publishes the sectoral evolution of electricity demand in large consumers (contracted power equal to or greater than 450 kW), with the name of Electricity Network Index (IRE). The analysis developed uses the corrected data of the IRE indicator (Red Eléctrica España, 2022), from January 2010 to December 2021. Table 2 shows all sectors, subsectors, and sub subsectors (National Classification of Economic Activities – CNAE code) of these activities with their respective percentage share in electricity demand for 2010 (base year of the IRE indicator).
Table 2. Percentage share of final electricity demand of large consumers. 2010 (base year).
| Large consumers (contracted power equal to or greater than 450 kW) | % |
| Industrial sector | 68.6 |
| Consumer goods (CNAE) | 9.0 |
| Food (10) | 5.98 |
| Beverages (11) | 1.06 |
| Tobacco (12) | 0.05 |
| Clothing (14) | 0.06 |
| Footwear (15) | 0.08 |
| Graphics and recording (18) | 0.47 |
| Pharmacy (21) | 0.94 |
| Furniture (31) | 0.22 |
| Other (32) | 0.12 |
| Intermediate goods (CNAE) | 51.8 |
| Textile (13) | 0.88 |
| Wood and cork (16) | 1.16 |
| Paper (17) | 5.42 |
| Refined products (19) | 1.66 |
| Chemical (20) | 7.82 |
| Rubber and plastics (22) | 4.66 |
| Non-metallic minerals (23) | 6.54 |
| Metallurgy (24) | 23.71 |
| Capital goods (CNAE) | 7.8 |
| Metallic products (25) | 1.95 |
| Electronic and computer equipment (26) | 0.21 |
| Electrical equipment (27) | 1.41 |
| Machinery and mechanical equipment (28) | 0.43 |
| Vehicles (29) | 3.25 |
| Other transportation materials (30) | 0.56 |
| Repair of machinery and equipment (33) | 0.02 |
| Services sector (CNAE) | 23.3 |
| Commerce (45/46/47) | 6.7 |
| Transport (49/51/52/53) | 5.5 |
| Audiovisual information (58/59/60/61/63) | 1.4 |
| Tourism (55/56/79) | 1.2 |
| Financial and insurance (64/65/66) | 0.7 |
| Business services (62/68/69/70/71/72/7374/77/80/81/82) | 2.0 |
| Public services and others (84/85/86/8788/90/91/92/93/94/96/97/99) | 5.9 |
| Other activities sector (CNAE) | 8.2 |
| Primary sector (01/02/03) | 1.0 |
| Extractive activities (05/06/07/08/09) | 1.7 |
| Energy, water and waste (35/36/37/38/39) | 4.4 |
| Construction (41/42/43) | 1.1 |
| Total | 100.0 |
The IRE indicator shows the percentage variation of final electricity demand for each economic activity with respect to the base year and with monthly resolution.
To convert the above percentage share of final electricity demand in terms of energy, the final metered demand for 2012 is used (Red Eléctrica España, 2014). The final electricity demand in 2012 was 101 777 GWh and the IRE indicator was 99.012%, therefore, the final electricity demand in 2010 was 102 792 GWh. Then, the percentage share of each economic activity is used to calculate the energy demand by each sector, subsector and sub subsector in the base year. Finally, the monthly percentage variation of the IRE indicator is applied, from January 2010 to December 2021.
Results
The subsectors corresponding to the industrial sector of the IRE indicator are regrouped to make the comparison with MITERD statistical data (from the other activities sector, the extractive and construction subsectors are extracted and added to the industrial sector).
Table 3 shows the final electricity demand by large consumers in Spain, from 2010 to 2021.
Table 3. Final electricity demand of large consumers in Spain. 2010-2021.
| Electricity demand sectors (GWh) | 2010 | Period from 2010 to 2021 | 2021 | ||
| Average | Minimum | Maximum | |||
| Industrial sector (CNAE) | 73 247 | 72 378 | 66 911 | 75 646 | 70 538 |
| Metallurgy (24) | 24 300 | 21 632 | 16 759 | 25 952 | 18 857 |
| Chemical y petrochemical (19/20) | 9 716 | 11 000 | 9 716 | 12 166 | 9 718 |
| Non-metallic minerals (23) | 6 703 | 6 836 | 5 829 | 7 968 | 7 968 |
| Transport equipment (29) | 3 321 | 3 419 | 2 822 | 3 747 | 2 822 |
| Machinery (25/26/27/28/30/33) | 4 680 | 4 773 | 4 342 | 5 200 | 4 799 |
| Extractives industries (05/06/07/08/09) | 1 744 | 2 016 | 1 744 | 2 186 | 2 168 |
| Food, beverages y tobacco (10/11/12) | 7 290 | 8 072 | 7 290 | 9 244 | 9 244 |
| Pulp, paper y graphic arts (17/18) | 6 038 | 5 654 | 5 304 | 6 038 | 5 502 |
| Wood and wood products (16/31) | 1 415 | 1 424 | 1 232 | 1 688 | 1 688 |
| Construction (41/42/43) | 1 128 | 1 024 | 905 | 1 128 | 944 |
| Textile and leather products (13/14/15) | 1 046 | 1 012 | 896 | 1 079 | 994 |
| Not elsewhere specified (21/22/32) | 5 866 | 5 517 | 5 042 | 5 888 | 5 835 |
| Services sector (CNAE) | 24 005 | 24 931 | 23 187 | 26 050 | 24 792 |
| Commerce (45/46/47) | 6 873 | 7 383 | 6 873 | 7 875 | 7 786 |
| Transport (49/51/52/53) | 5 642 | 6 068 | 5 556 | 6 582 | 6 067 |
| Audiovisual information (58/59/60/61/63) | 1 436 | 1 326 | 1 188 | 1 436 | 1 188 |
| Tourism (55/56/79) | 1 231 | 1 124 | 661 | 1 234 | 795 |
| Financial and insurance (64/65/66) | 718 | 610 | 467 | 718 | 504 |
| Business services (62/68-74/77/80/81/82) | 2 052 | 1 961 | 1 719 | 2 099 | 1 848 |
| Public services (84-88/90-94/96/97/99) | 6 053 | 6 460 | 6 053 | 6 780 | 6 604 |
| Other activities sector (CNAE) | 5 540 | 6 730 | 5 540 | 7 602 | 7 420 |
| Primary sector (01/02/03) | 1 026 | 1 360 | 1 026 | 1 531 | 1 491 |
| Energy, water and waste (35/36/37/38/39) | 4 514 | 5 370 | 4 514 | 6 071 | 5 930 |
| TOTAL | 102 792 | 104 039 | 97 349 | 108 688 | 102 750 |
| Total final electricity demand in Spain | 244 802 | 234 144 | 219 655 | 244 802 | 227 881 |
| Percentage share of large consumers (%) | 42.0 | 44.4 | 44.3 | 44.4 | 45.1 |
The electricity demand of large consumers represents 44.4% of the total electricity demand in Spain, and the large consumers of the secondary (industrial) sector represent 96.9% of the total electricity demand in this sector (72 378 GWh – IRE data from Table 3, and 74 682 GWh – MITERD data from Table 1), situation that allows to infer that practically the totality of the industrial electricity demand belongs to the group of large consumers.
The large consumers of the primary sector (agriculture, forestry, fishing) and tertiary sector (commerce, services, education, transportation) represent 36.6% of the total electricity demand in both sectors (31 661 GWh – IRE data from Table 3, and 86 619 GWh – MITERD data from Table 1). This situation makes it possible to consider them as important actors for the development of flexibility resources.
Fig. 1 shows the behaviour of the final electricity demand by large consumers in Spain, from January 2010 to December 2021, according to the classification in the annual energy balance report: industrial sector, transport sector (sub subsector land transport – CNAE 49), and other sectors (subsectors commerce; transport without CNAE 49; audiovisual information; tourism; financial and insurance; business services; public services and others; primary sector; and energy, water and waste are grouped together).
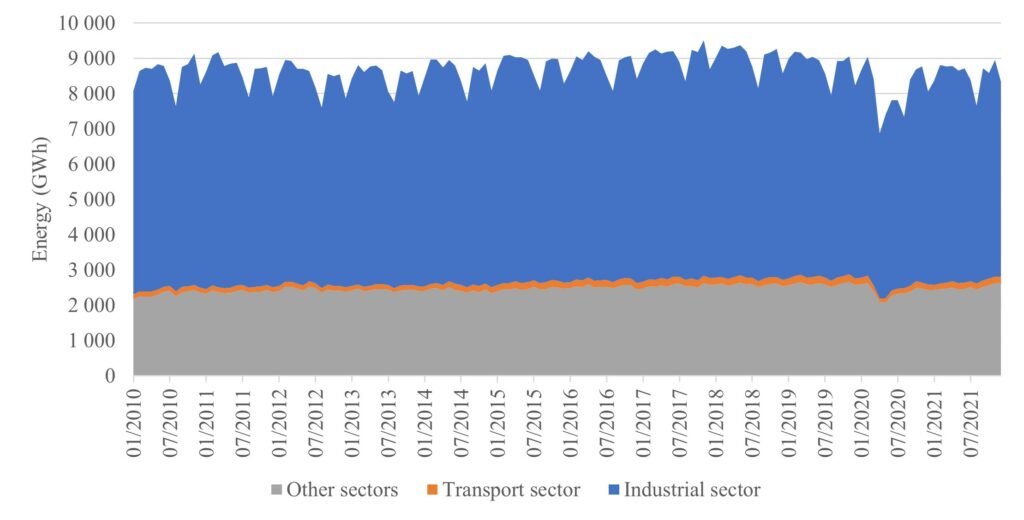
Figure 1. Final electricity demand of large consumers by sectors. 01/2010 to 12/2021.
Source: Prepared by the author with REE data (Red Eléctrica España, 2022).
The other sectors maintain practically identical demand for all the months of the twelve years analysed, except for 2020, which experiences a reduction in demand, explained by the health crisis caused by COVID-19.
The transport sector has a small share in the electricity demand.
The industrial sector maintains a stable and regular demand for the period analysed, with the months of August and December of all years being those with the lowest demand, explained by the summers holidays and the end of year festivities. April 2020 has the lowest demand of the entire period analysed, and the explanation is the same as in the other sectors.
Conclusions
The final electricity demand of large consumers from the secondary sector (industrial) represents 96.9% of the total final electricity demand in Spain of this sector, from 2010 to 2021. The final electricity demand of large consumers from the primary and tertiary sectors represents 36.6% of the total final electricity demand in Spain of these sectors, from 2010 to 2021.
The final electricity demand of large consumers represents 44.4% of the total final electricity demand in Spain, from 2010 to 2021.
The high participation of large consumers on the total final electricity demand in Spain, gives an interesting possibility to develop their capacity to shift or curtail their loads, and help offset fluctuations in intermittent renewable generation.
For future research, estimation of industrial and commercial demand flexibility potential can be calculated, to be incorporated into the electricity system and support the energy transition.
References
Cochran, J., Miller, M., Milligan, M., Ela, E., Arent, D., & Bloom, A. (2013). Market Evolution: Wholesale Electricity Market Design for 21st Century Power Systems. https://www.nrel.gov/docs/fy14osti/57477.pdf
DNV, & ACER. (2021). Study on a methodology to benchmark the performance of the EU member states in terms of: efficient price formation and easy market entry and participation for new entrants and small actors.
Milligan, M., Frew, B. A., Bloom, A., Ela, E., Botterud, A., & Townsend, A. (2016). Wholesale electricity market design with increasing levels of renewable generation: Revenue sufficiency and long-term reliability. Electricity Journal, 29(2), 26–38. https://doi.org/10.1016/j.tej.2016.02.005
MITERD. (2022, November 30). Informe Metodológico Estandarizado – Balance Energético Anual. Ministerio Para La Transición Ecológica y El Reto Demográfico. https://energia.gob.es/balances/Balances/metodologia/Informe_Metodologico_Balance_ Energetico-Anual.pdf
MITERD. (2023, January 30). Balance Energético de España 1990-2021. Ministerio Para La Transición Ecológica y El Reto Demográfico. https://energia.gob.es/balances/Balances/balandeenergeticoanual/Balance-Energetico- Espana-1990_2021_es_V0.ods
PwC España, CIEMAT, & Fundación Naturgy. (2021). El papel del almacenamiento en la Transición Energética. https://www.fundacionnaturgy.org/publicacion/el-papel-del-almacenamiento-en-la-transicion-energetica/
Red Eléctrica España. (2014). Nota metodológica de publicación del índice IRE de consumo eléctrico de grandes consumidores.
Red Eléctrica España. (2022, November 21). Evolución sectorial de la demanda engrandes consumidores. Formato csv con datos corregidos. https://www.ree.es/es/datos/demanda/ire-general
Red Eléctrica España. (2023, February 6). Evolución sectorial de la demanda en grandes consumidores. Formato pdf. https://www.ree.es/es/datos/demanda/ire-general
How does Lithium electrodeposit in open-porous Cu micro-foams for Zero-Excess Lithium Metal Batteries?
Ingber, T. T. K.1
Corresponding author
tjark.ingber@uni-muenster.de
Bela, M.1
Püttmann, F.1
Dohmann, J. F.1
Bieker, P.2
Börner, M.1
Winter, M.1,2
Stan, M. C.2
1 MEET Battery Research Center, University of Münster
Corrensstraße 46, 48149 Münster, Germany
2 Helmholtz-Institute Münster, IEK-12, Forschungszentrum Jülich GmbH
Corrensstraße 48, 48149 Münster, Germany
Keywords: lithium deposition behavior, zero-excess lithium metal batteries, copper micro-foam, porous substrates, Cryo-FIB-SEM
This extended abstract is based on (Ingber et al., 2023). All contents are reproduced with permission from the Royal Society of Chemistry.

Background
The ongoing evolution of mobile electrically powered devices ranging from smartphones to electric cars and beyond demands rapid progress in portable energy storage solutions (Liu et al., 2022). As the current Lithium-Ion Batteries (LIBs) approach physical and engineering-related limits in performance development, alternative battery concepts are receiving increased attention from R&D in companies and academia. Lithium Metal Batteries (LMBs) with Lithium (Li)metal-based negative electrodes and layered transition metal oxide-based lithiated positive electrodes are among the most promising candidates for future portable energy storage systems owing to the veryhigh theoretical specific energy of Li metal (Zhang et al., 2020). To maximize the achievable practical energy of an LMB cell by reducing weight and volume as much as possible, researchers aim to continuously decrease the amount of surplus Li metal present at the negative electrode, reducing the capacity overhang (often referred to as Li excess) of the negative electrode in comparison to the positive electrode. The culmination of this research trend is the so-called Zero-Excess LMB (ZELMB)that uses only a Li-free current collector as the negative electrode, translating to a Li excess of 0% in relation to the Li content of the positive electrode (Heubner et al., 2021).
The operation of ZELMBs is based on the formation of a temporary Li metal layer on the negative electrode current collector (henceforth denoted as ‘deposition substrate’) during charging, followed by electrochemical dissolution of that layer and reintegration of the Li into the positive electrode material during discharging of the battery. Apart from their increased specific energy and energy density as compared to conventional LMBs, the absence of Li metal at the time of cell assembly also makes ZELMBs cheaper, easier to manufacture, and safer in pristine state. However, the lack of a permanent Li metal reservoir means that any loss of Li due to reactions with the electrolyte, formation of a Solid Electrolyte Interface (SEI), generation of inactive ‘dead’ Li, or other factors directly translates to a decrease of the cyclable capacity of the battery (Huang et al., 2021). Therefore, it is of great importance to operate the battery as efficiently and free of Li losses as possible, which is indicated by a high Coulombic Efficiency (CE).
Among the many strategies to achieve maximized CE values such as electrolyte design or cycling conditions optimization, tailoring of the negative electrode deposition substrate is of key importance. Apart from functional coatings of the surface, researcher attention is also devoted to the use of 3D structured deposition substrates. Previous studies have shown that this approach can significantly boost the cycling performance and lifespan of ZELMBs (Xie et al., 2020).
Aim of the study
The present work shows a detailed exploration of the ZELMB-related Li deposition behavior inside an open-porous 3D structured deposition substrate. An open-porous Copper (Cu) micro-foam material is created using an optimized templated electrodeposition-based synthesis procedure. As a novelty in ZELMB research, cryogenic focused ion beam-enabled scanning electron microscopy (Cryo-FIB-SEM) of cross-sections is combined with traditional top-view SEM imaging and electrochemical investigations to comprehensively elucidate the Li deposition behavior in the created Cu micro-foam. Thereby, this study provides fundamental understanding about the Li deposition in an open-porous medium that is currently lacking in ZELMB research.
Methodology
As the template used to create the Cu micro-foams, polylactic acid (PLA) micro-particles are synthesized from an emulsion of PLA-carrying dichloromethane (DCM) droplets in an aqueous solution of polyvinyl alcohol (PVA). After the DCM has been evaporated under vigorous stirring, white PLA micro-particles are obtained by filtration. These micro-particles are mixed with ethanol for application to Cu foil discs by drop-casting and dried to create a micro-template. Aqueous electrodeposition is then used to fill up the gaps in the template with metallic Cu. Finally, dissolution of the PLA template by washing with DCM reveals the prepared Cu micro-foam structure.
The Cu micro-foam negative electrodes are used in a coin cell battery setup together with LiNi0.8Co0.15Al0.05O2 (NCA)-based positive electrodes and a liquid electrolyte formulation consisting of a mixture of lithium difluoro(oxalato) borate (LidFOB) and lithium tetrafluoroborate (LiBF4) in diethyl carbonate (DEC) and fluoroethylene carbonate (FEC). After electrochemical deposition of various amounts of Li onto the Cu micro-foams, they are retrieved from the cells to analyze the Li distribution using SEM imaging of top-views and Cryo-FIB-created cross-sections. Alternatively, the ZELMB coin cells are taken through 100 full charge/discharge cycles at a current density of 0.2 mAcm-2 to analyze their short-term and long-term electrochemical operating behavior.
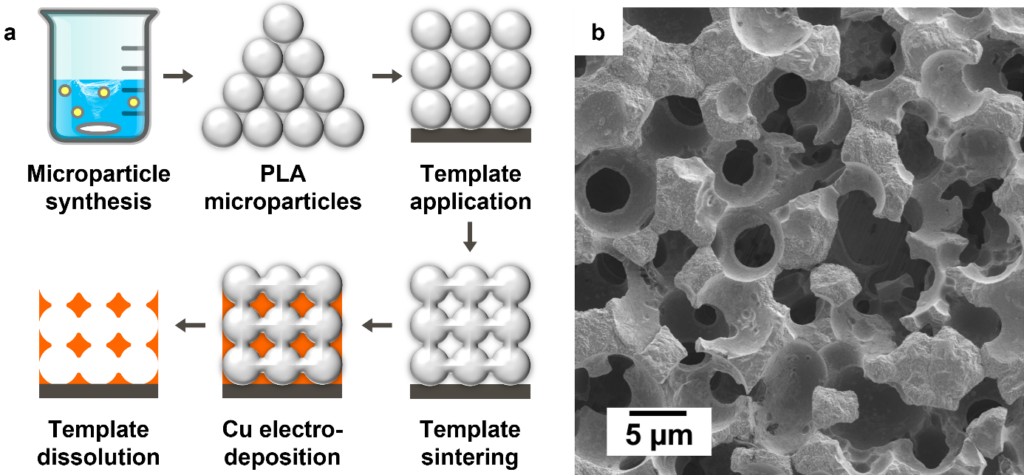
Figure 1. (a) Synthesis route used to fabricate Cu micro-foams via an optimized templated electrodeposition approach. (b) Top-view SEM image of the created Cu micro-foam material.
Results and discussion
Adapted from (Ingber et al., 2023) with permission from the Royal Society of Chemistry.
Figure 1 shows an overview of the applied Cu micro-foam synthesis route as well as a top-view SEM image of the prepared material. The micro-foam shows a highly interconnected network of spherical open pores that offer high accessibility for the liquid electrolyte and a large internal volume for the accommodation of Li metal.
Figure 2 depicts the Li deposition behavior in the created Cu micro-foam in comparison to a flat Cufoil. Apparently, the Li electrodeposition covers the surface of the Cu micro-foams to a lesser extent (Figure 2b,c) as compared to a flat Cu foil (Figure 2f,g) at equal deposition conditions. While the Cu foil is almost completely overgrown with Li structures (seen in dark grey) after a Li amount equal to 1.0 mAh cm-2 was deposited, less than half of the Cu micro- foam surface is covered in Li metal after the same treatment. The main reason for this is the open-porous morphology of the Cu micro-foam that allows for extensive storage of Li metal in surface and sub-surface pores (Figure 2d), thereby minimizing surface coverage. Also, the much larger surface area of the micro-foam compared to the flat foil facilitates a wider distribution of the electrical current applied for electrodeposition, which leads to a lower local current density at the micro-form surface. In turn, this allows for the formation of denser Li metal structures that occupy less space on the micro-foam surface but fit well into the pores.
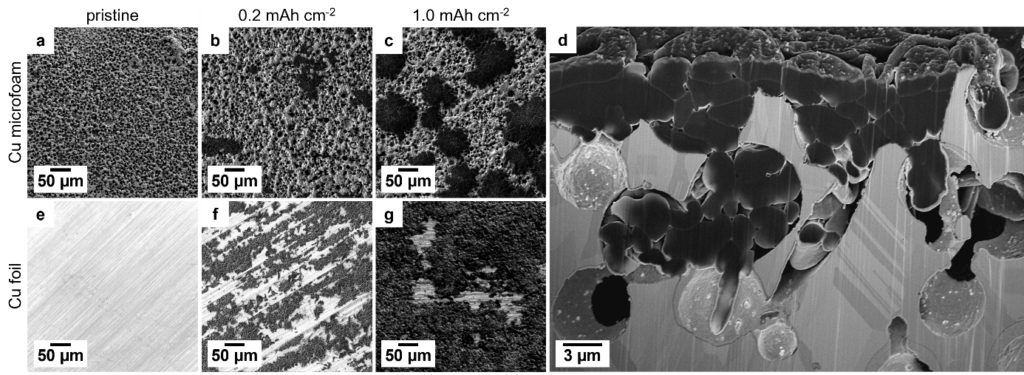
Figure 2. Top-view SEM images of pristine (a) Cu micro-foam and (e) Cu foil substrates compared to metallic Li (seen in dark grey) deposited on (b-c) Cu micro-foams and (f-g) Cu foil. (d) Cross-sectional cryo-FIB-SEM image of Li electrodeposited inside the pores of a Cu micro-foam. Li amounts equal to (b,d,f) 0.2 mAh cm-2, and (c,g) 1 mAh cm-2 were deposited using a current density of 0.1 mAcm-2. Adapted from (Ingber et al., 2023) with permission from the Royal Society of Chemistry.
The observed deposition mode is beneficial for the operation of ZELMBs as it reduces volume fluctuation of the deposition substrate during charging and discharging, avoiding excessive mechanical stress that can wear down the components of the battery quickly. Also, the dense deposition morphology mitigates the harmful formation of so-called high surface area lithium (HSAL) that is a common problem for LMBs as it leads to low CEs and increases the risk of potentially dangerous short-circuits. Furthermore, the lower surface area of the Li electrodeposition structures on the Cu micro-foam reduces the amount of detrimental decomposition reactions between the Li and the liquid electrolyte, thereby contributing to a better conservation of the Li inventory in the battery.
The positive effects of using the Cu micro-foam as the ZELMB deposition substrate is also apparent from the electrochemical investigation results in Figure 3. The voltage profiles in Figure 3a-b show that the nucleation overpotential of Li electrodeposition is lower for Cu micro-foams than for Cu foil due to the larger surface area and more distributed current density, leading to a lower activation barrier. On the other hand, the micro-foam’s larger surface area also causes the slower drop of the respective voltage curve, representing a higher amount of charge-consuming surface reactions that happen before the start of the Li deposition.
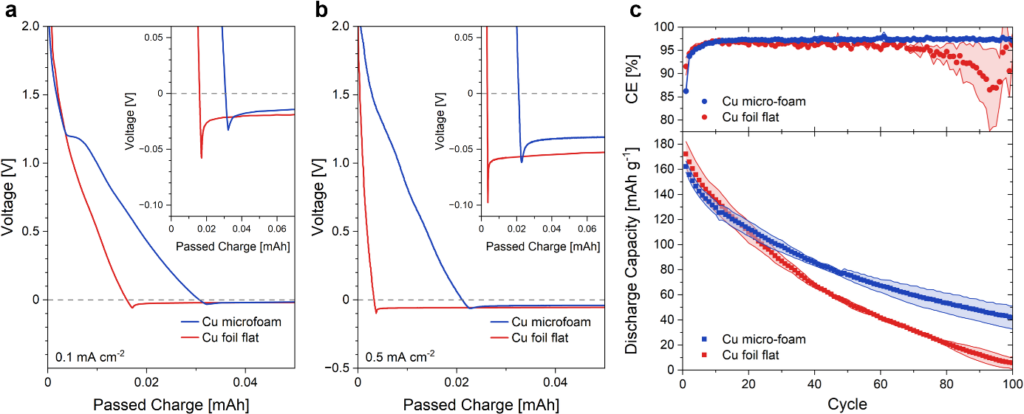
Figure 3. (a-b) Voltage vs. transferred charge profiles acquired during the early phase of galvanostatic Li electrodeposition on Cu foil (red) and Cu micro-foam (blue) current collectors. Nominal current density: (a) 0.1 mA cm-2 or (b) 0.5 mA cm-2. The insets show zoomed-in views of thevoltage area relevant for Li nucleation. (c) Coulombic efficiency and average discharge capacity for charge/discharge cycling of NCA || Cu foil (red) or NCA || Cu micro-foam (blue) cells with a currentdensity of 0.2 mA cm-2 (0.2 C) for 100 cycles at 40 °C. Adapted from (Ingber et al., 2023) with permission from the Royal Society of Chemistry.
Figure 3c reveals that this higher initial charge consumption results in lower first cycle CE and discharge capacity values for cells with the Cu micro-foam compared to Cu foil. However, due to the aforementioned superior Li electrodeposition morphology, the Cu micro-foam- containing cells soon show a much better evolution of the CE and capacity curves than the Cufoil-based cells. Specifically, the micro-foam cells’ CE is continuously above 97% and the cells still have a substantial amount of cyclable capacity left after 100 cycles, while the Cu foil cells already lost all their capacity at that point due to severe fluctuations in the CE.
Conclusion, implications, limitations
For the first time in ZELMB research, the combination of cryo-FIB-enabled and traditional SEMimaging reveals the favorable and dense Li electrodeposition morphology occurring in an open-porous Cu micro-foam substrate that was created using an optimized templated electrodeposition route. Electrochemical investigations show that the usage of these micro- foams as deposition substrates inZELMBs boosts the cycling stability, leading to a longer cycle life. These results highlight that 3D-structured porous deposition substrates can be a promising building block for the development of application-ready ZELMBs. Also, ZELMBs using the open-porous Cu micro-foam deposition substrate can serve as stable-running analytical tools to analyze the Li charge/discharge cycling behavior in detail without hiding potential problems behind a mask of high Li excess. To maximize the achievable cycle life of ZELMBs using the Cu micro-foams, future studies can optimize the Liuptake properties of the deposition substrate by tailoring the geometrical and chemical characteristics, enabling deposition of Li metal further down in the pore network while reducing the amount of unused pore space in the micro-foams.
References
Heubner, C., Maletti, S., Auer, H., Hüttl, J., Voigt, K., Lohrberg, O., Nikolowski, K., Partsch, M., & Michaelis, A. (2021). From Lithium‐Metal toward Anode‐Free Solid‐State Batteries: Current Developments, Issues, and Challenges. Advanced Functional Materials, 2106608. https://doi.org/10.1002/adfm.202106608
Huang, C.‑J., Thirumalraj, B., Tao, H.‑C., Shitaw, K. N., Sutiono, H., Hagos, T. T., Beyene, T. T.,
Kuo, L.‑M., Wang, C.‑C., Wu, S.‑H., Su, W.‑N., & Hwang, B.‑J. (2021). Decoupling the originsof irreversible coulombic efficiency in anode‐free lithium metal batteries. Nature Communications, 12(1), 1–10. https://doi.org/10.1038/s41467‐021‐21683‐6
Ingber, T. T. K., Bela, M. M., Püttmann, F., Dohmann, J. F., Bieker, P., Börner, M., Winter, M., & Stan, M. C. (2023). Elucidating the Lithium Deposition Behavior in Open‐Porous Copper Micro‐Foam Negative Electrodes for Zero‐Excess Lithium Metal Batteries. Journal of Materials Chemistry A, DOI: 10.1039/d3ta04060g. https://doi.org/10.1039/d3ta04060g
Liu, W., Placke, T., & Chau, K. T. (2022). Overview of batteries and battery management for electric vehicles. Energy Reports, 8, 4058–4084. https://doi.org/10.1016/j.egyr.2022.03.016
Xie, Z., Wu, Z., An, X., Yue, X., Wang, J., Abudula, A., & Guan, G. (2020). Anode‐freerechargeable lithium metal batteries: Progress and prospects. Energy Storage Materials,32, 386–401. https://doi.org/10.1016/j.ensm.2020.07.004
Zhang, Y., Zuo, T.‑T., Popovic, J., Lim, K., Yin, Y.‑X., Maier, J., & Guo, Y.‑G. (2020). Towards better Li metal anodes: Challenges and strategies. Materials Today, 33, 56–74. https://doi.org/10.1016/j.mattod.2019.09.018
Life Cycle assessment of vertical green systems of landscaping through the “BIM” and “Advanced Technologies” in Spain
Gachkar, D.
Corresponding author – presenter
dargac@alum.us.es; Universidad de Sevilla, Spain
I express my gratitude for the invaluable assistance provided by my advisors, Antonio Garcia Martinez and Cecilio Angulo Bahón.
Keywords: Climate change, Greenhouse gas emissions, Green façade, Life Cycle Assessment, Advanced Technologies, Digital Twins, Artificial Intelligence, Sustainable construction.

Climate change and its associated concerns, such as urban heat islands and greenhouse gas (GHG) emissions, have become pressing global issues as urbanization continues to rise. The construction industry, a major contributor to environmental degradation, demands innovative solutions to minimize its ecological footprint. This study aims to explore the potential of green façades as an optimal ecological sustainable landscape design to reduce GHG emissions, employing Life Cycle Assessment(LCA). By integrating advanced technologies such as Digital Twins (DT) and Artificial Intelligence (AI) algorithms, the research seeks to develop a comprehensive methodology for sustainable construction and decision-making processes.
The literature review establishes the critical link between GHG emissions and energy consumption in buildings, emphasizing the need for eco-friendly urban design. Nowadays a worldwide growinginterest in sustainable urban environment is encouraging the application of greening technologies forbuildings. Within these, green vertical systems play an important role with the advantage of notinvolving land consumption. Vegetated vertical systems include two main categories: green façadesand living walls (Blanco et al., 2021).Green façades, with their multifaceted benefits encompassingeconomic, social, and environmental aspects, offer an effective solution. These benefits include the reduction of the heat island effect, mitigation of GHG emissions, climate change adaptation, improved air quality, energy savings through insulation, habitatprovision, and enhanced aesthetics. In the recent literature, many claims were made about the positive influences of living walls. The environmental benefits of living walls are; increasing the thermal performance of buildings, improving air quality, mitigating the Urban Heat Island effect, reducing noise pollution, improving water sensitive urban design, increasing urban biodiversity, and improving human health and wellbeing (Feng & Hewage, 2014). In the beginning of the eighties Krusche et al., 1982 have estimated that the thermal transmittance of a 160 mm plant cover is 2.9 W m−2 K−1. Minke& Witter, 1982 also suggested to reduce the exterior coefficient of heat transfer. By reducing the wind speed along a green facade the exterior surface resistance coefficient can be equalized to the interior surface resistance coefficient as demonstrated by (Perini et al., 2011). Also Eumorfopoulou & Kontoleon, 2009 have reported a temperature cooling potential of plant covered walls in a Mediterranean climate; the effect was up to 10.8 ◦C. Another study by Wong et al., 2010 on a free standing wall in Hortpark (Singapore) with vertical greening types shows a maximum reduction of 11.6 ◦C.
In the urban area, the impact of evapotranspiration and shading of plants can significantly reduce theamount of heat that would be re-radiated by facades and other hard surfaces. Besides that, the green plant layer will also reduce the amount of UV light that will fall on building materials. Since UV light deteriorates the material and mechanical properties of coatings, paints, plastics, etc. plants will also have positive effect on durability aspects and on maintenance costs (Ottelé et al., 2011). Life-cycle assessment (LCA) outlined by International Standards Organization (ISO) (2006) (ISO 14040, 2006) has been widely used for evaluating environmental performances of products or processes during theirentire life-cycle from cradle to grave or from cradle to gate (Wang et al., 2020). To date, a number of LCA studies have been performed to compare the environmental performances of the green roofs and facades with traditional infrastructures. Manso et al., 2018 showed results demonstrating that the environmental performance differences are due to supporting material and to the replacement of materials and plants. Indirect greening systems are characterized by a high environmental burden. Some attempts have been made to analyze the contribution of different UGIs to urban water management, specifically focusing on the water supply, sewage treatment, and flood protection using LCA and other methods (Liu et al., 2016).Vacek et al., 2017 focused on Life Cycle Assessment of four semi-intensive green roof assemblies, i.e. common assembly, assembly with added extruded polystyrene providing increased thermal resistance and two assemblies with hydrophilic mineral wool. Apart from increasing thermal insulation, this material also partially substitutes plant substrate and fulfils role of a water reservoir.
According to this background, considered that there are only a few studies on the sustainability of vertical greeneries from a life cycle perspective. The aim of this study is to assess the life cycle of vertical green systems in landscaping using BIM and advanced technologies, specifically focusing on their potential to reduce GHG emissions. The research aims to contribute to sustainable construction practices by developing a comprehensive methodology that integrates LCA with DT and AI algorithms. The novelty lies in the application of these advanced technologies to analyze the environmental and energy performance of buildings with green façades.
This research method is quantitative and performs a comparative environmental assessment of different façades with existing systems for low-GHG residential buildings of neighborhood (PolígonoSan Pablo in Sevilla) and identified the importance of the inclusion of each scenario.
A framework is designed to incorporate BIM and Advanced technologies-based Life Cycle Assessment (LCA) for reducing the challenges of traditional LCA in achieving green buildings. This study intends to achieve the objectives of the research by conducting three phases. In the first phase, the current GHG emissions during the LCA of selected buildings are measured. Then, in the secondphase, the impact of different component of facade alternatives in buildings in selected area is presentedand the impact of each of them on GHG emissions is examined. In the scope of this research project,after detailed research and creation of prototypes for different green systems, the alternative potential of vertical green systems to reduce GHG will be analyzed with integration of BIM, DT and LCA tools. Data collected via DT can be used to record and evaluate the existing state of the buildings, which informs appropriate decisions about which facade is most suitable for the building Finally, buildings green facades in neighborhood will be designed with the approach of minimum GHG emissions. Furthermore, in this study integration of AI technology in relation to BIM and DT will be used. Artificial intelligence (AI) is a pre-programmed system that caters to individual users’ preferences for various services in various contexts. It allows us to change the temperature, humidity, lighting, ventilation speed and electrically controlled. The concept of AI is offered as a smart controller with a broader data collection system and a multi-appliance control interface.
The findings of this study contribute to advancing the understanding of LCA in vertical green systems and highlight the use of advanced technologies in sustainable construction practices. The results demonstrate the potential of green façades in reducing GHG emissions, improving energy efficiency, and enhancing the overall environmental performance of buildings. Through LCA and the integration of BIM, AI algorithms, and DT technology, the study provides valid estimations of energy and environmental performance throughout a building’s life cycle. The research findings reveal several significant outcomes regarding the life cycle assessment of vertical green systems in landscaping and the integration of advanced technologies:
Current GHG Emissions: The study measured the current GHG emissions of selected buildings in Polígono San Pablo, Sevilla. The data analysis revealed the substantial environmental impact of traditional building designs and highlighted the need for sustainable alternatives.
Impact of Facade Components: Through LCA, the research evaluated the impact of various facade components on GHG emissions. The analysis demonstrated that integrating green façades significantly reduces carbon emissions compared to conventional building designs. The incorporation of vegetation, insulation materials, and renewable energy systems proved to be effective strategies in minimizing the ecological footprint.
Integration of BIM and LCA Tools: The study examined the integration of vertical green systems into Building Information Modeling (BIM) LCA tools. This integration allowed for more accurate and comprehensive assessment of the environmental and energy performance of buildings throughout their life cycle. It provided valuable insights into the potential benefits and trade-offs associated with different design scenarios.
Advantages of Advanced Technologies: The utilization of Artificial Intelligence (AI) algorithms enabled the analysis of large datasets, revealing functional connections between input and output variables. This approach allowed for more precise predictions and optimization of building performance. Additionally, the use of Digital Twins (DT) technology facilitated real-time monitoring and adjustment of building conditions, leading to more efficient building operations.
Environmental and Economic Benefits: The findings demonstrated that green façades offer multifaceted benefits, including the reduction of the urban heat island effect, improved air quality, energy savings through insulation, and enhanced aesthetics. These benefits contribute to the overall sustainability and live ability of urban environments. Moreover, the study revealed that investments in sustainable construction practices can lead to long-term cost savings due to reduced energy consumption and maintenance expenses.
Overall, the research findings support the notion that vertical green systems, when integrated with advanced technologies and analyzed through LCA, provide a viable and effective solution for reducing GHG emissions and promoting sustainable construction practices. These findings have practical implications for decision-makers in the construction industry, highlighting the importance of considering green façades and utilizing advanced technologies in urban design projects.
In conclusion, this study highlights the effectiveness of green façades as an ecological sustainable landscape design strategy for reducing GHG emissions in urban environments. The research emphasizes the managerial implications of incorporating advanced technologies, such as DT and AI algorithms, into the decision-making process of sustainable construction. However, certain limitations exist, including the need for further validation of the proposed methodology and the specific applicability of the findings to the Polígono San Pablo context.
References
Blanco, I., Vox, G., Schettini, E., & Russo, G. (2021). Assessment of the environmental loads of green façades in buildings: A comparison with un-vegetated exterior walls. Journal of Environmental Management, 294, 112927.
Eumorfopoulou, E. A., & Kontoleon, K. J. (2009). Experimental approach to the contribution of plant- covered walls to the thermal behaviour of building envelopes. Building and Environment, 44(5), 1024–1038. https://doi.org/10.1016/j.buildenv.2008.07.004
Feng, H., & Hewage, K. (2014). file:///C:/Users/DARYA/Downloads/scholar – 2023-06- 16T162627.512.ris. Journal of Cleaner Production, 69, 91–99.
Krusche, P., Krusche, M., Althaus, D., & Gabriel, I. (1982). Okologisches Bauen Herausgegeben vom Umweltbundesamt. Wiesbaden Und Berlin: Bauverlag.
Liu, W., Chen, W., Feng, Q., Peng, C., & Kang, P. (2016). Cost-benefit analysis of green infrastructures oncommunity stormwater reduction and utilization: A case of Beijing, China. Environmental Management, 58, 1015–1026.
Manso, M., Castro-Gomes, J., Paulo, B., Bentes, I., & Teixeira, C. A. (2018). Life cycle analysis of a new modular greening system. Science of the Total Environment, 627, 1146–1153.
Minke, G., & Witter, G. (1982). Häuser mit grünem Pelz. Ein Handbuch Zur Hausbegrünung, 498.
Ottelé, M., Perini, K., Fraaij, A. L. A., Haas, E. M., & Raiteri, R. (2011). Comparative life cycle analysis forgreen façades and living wall systems. Energy and Buildings, 43(12), 3419–3429.
Perini, K., Ottelé, M., Fraaij, A. L. A., Haas, E. M., & Raiteri, R. (2011). Vertical greening systems and theeffect on air flow and temperature on the building envelope. Building and Environment, 46(11), 2287–2294.
Vacek, P., Struhala, K., & Matějka, L. (2017). Life-cycle study on semi intensive green roofs. Journal of Cleaner Production, 154, 203–213.
Wang, Y., Ni, Z., Hu, M., Li, J., Wang, Y., Lu, Z., Chen, S., & Xia, B. (2020). Environmental performances and energy efficiencies of various urban green infrastructures: A life-cycle assessment. Journal of Cleaner Production, 248, 119244.
Wong, N. H., Tan, A. Y. K., Chen, Y., Sekar, K., Tan, P. Y., Chan, D., Chiang, K., & Wong, N. C. (2010). Thermal evaluation of vertical greenery systems for building walls. Building and Environment, 45(3), 663–672.
Pathways to build back better: comparing Italy, France and Spain strategies to face green and smart transition of infrastructural network
Costa, V.
Corresponding author – presenter
valentina.costa@edu.unige.it
University of Genoa, Italy
Soraggi, D. and Campanini, F.
University of Genoa, Italy
Keywords: Infrastructures, Green transition, National Recovery and Resilience Plans

Background of the study
Covid-19 shakedown led European Union to implement an unprecedented strategy in effort and magnitude (Luo, 2022; Posaner and Mischke, 2020). The need to recover from pandemic- related crisis, together with Climate Change emergency supported the implementation of Next Generation EU initiative through Recovery Fund, thus involving an overall amount of 723.8 billions Euros (made up by an approximate 47% share of Grants and 53% of Loans) (Afman et al., 2021). Present strategy was developed enhancing previous EU initiatives to ensure a greener, smarter and more inclusive recovery(European Commission, 2019). Subsequently, six main pillars were identified: (i) Green Transition, (ii) Digital Transformation, (iii) Smart, Sustainable and Inclusive Growth, (iv) Social and Territorial Cohesion, (v) Health and Economic, Social and Institutional Resilience, (vi) Policies for the Next Generation.
Fundings were then distributed among all Member States, nevertheless, significant differences are present.
First relevant gap concerns resources allocation per State (Darvas, 2020), second one resources destination per pillar (and respective economic sector). Being resources allocation consequent of statistical, socio-economic and demographical EU bodies evaluation (Bisciari et al., 2021), as well as of political negotiations, resources destination may represent an interesting key to investigate how different countries plan their own green and smart transition (Gaglione and Ayiine-Etigo, 2021; Pilati, 2021).
In particular, infrastructural investments play a pivotal role in shaping future development and economic asset. Energy and transport sectors constitute indeed two of the main impacting sectors in terms of greenhouse gases (GHG) emissions’ production (EEA, 2019); consequently actions to pursue resilient, sustainable and digital recovery and transition would be heavily insisting on energy and transport infrastructures (Kivimaa et al., 2023, Belicka et al., 2022). National approach towards these sectorial investments would prove indeed extremely significant to deepen how Member States would like to shape their visions and future (Gierten and Lesher, 2022).
Aim of the study
Present work has the aim to investigate how infrastructural investments were channelled through Italian National Recovery and Resilience Plan (NRRP) (Italian Government, 2021) compared to the other Member States receiving the majority of EU funds. In particular, Italy benefitted from a 191 billions Euros amount of grants and loans, constituting the main share among EU States, followed by Spain (Spanish Government, 2021) with 70 billions Euros and France (French Government, 2021), with 39 billions Euros (European Commission, 2023).
The analysis of respective national initiatives in terms of goal formalization, pursued strategies as well as main lines of actions helps to identify Member States priorities in addressing both post-Covid19recovery and green and digital transition. Being the selected countries bordering countries it would be particular interesting and valuable not only the deepening of individual plans, but also the search for potential synergies and interrelations. In the EU perspective, indeed, overall effectiveness and success of NRRP policy would rely on the outcomes of the projects related to the identified six main pillars in terms of national sectorial improvements and upgrade concerning increased resilience and steps taken towards green and digital transition, but also in terms of global EU performances coming from a better cooperation, integration and alignment among national actions and goals. This prove to represent a quite crucial issue as far as energy and transport infrastructures are concerned. It is indeed self- evident that network effectiveness strongly depends on its internal level of connectivity and widespread capillarity, so that coordination among national initiatives constitutes the basis for overall system improvements. Moreover, even though punctual and local projects are concerned, their interrelationships within the general strategy as well as potential links going beyond national borders need to be highlighted, potentially representing important drivers paving the way for more rooted and bottom-up trans-national initiatives.
Methodology
National Plans, strategies and actions of these three main beneficiaries were therefore investigated to answer three main research questions.
Initial deepening concerned the comparison of national plans formal structure in addressing EU targeted goals. Document formal structure enabled authors to highlight general attitude, rationale and approach towards resilient recovery (Tagliapietra, 2021).
In this direction, the analysis of the National Resilience and Recovery Plans of Italy, France and Spain revealed some differences in approach. The latter two have a structure that aligns perfectly with the six pillars proposed by the EU. Instead, Italy proposes a different subdivision: recovery plan shapes around (i) and (ii) main cores; (iii) focuses on infrastructures and mobility; (iv) on education and research; (v) on inclusion and cohesion and finally (vi) on healthcare.
Each pillar of each NRRP is divided into ‘missions’; i.e., a set of technical objectives and actions that the state proposes to achieve with European investments.
Similar differences may lead to national peculiar way to set main targeted issues and respective solutions to meet specifical needs and goals.
Subsequently, as far as green transition, digital transformation and national strategies for infrastructures and sustainable mobility development are concerned, the aim is to understand how investments and actions are allocated within each of the three NRRPs initiatives. Research focuses indeed on technologies, energy sources and transport modes that have been selected by national institutions, as well as on the potential territorial outcomes descending from the identified projects.
Final investigation would concern compliance among national initiatives in terms of strategies and developing infrastructures. Looking at comprehensive and overall EU network integration, respective coherence among Member States actions is therefore pivotal to ensure effectiveness and improvement of current EU internal relations, thus gathering individual national efforts towards shared goals and achievements. Present issue proves to be essential to support long- term initiatives such as the Trans-European Transport Network, TEN-T (Nicodème, 2022) and Trans-European Networks for Energy,TEN-E (Quitzow et al., 2022) development and to boost local fragmented projects thus channelling them into a wider framework.
Starting from the concept of Common Indicators, proposed by the European Commission (2023) for evaluating the progress of the implementation of common objectives between nations, it will be appropriate to go into detail of similar actions and compare them, also in order to understand the meaning of their different declinations within the main pillars.
Result/findings and argumentation
These research questions are used as guiding lens to read respective national approach and initiatives to shape green and smart transition, thus highlighting potential synergies and conflicts, as well as to provide an overall view about possible collaborative framework within considered Member States. Italian initiative aims at investing 25.4 billion on the mission called ‘infrastructure for sustainable mobility’. This mission consists of two priority lines: rail network development (97.5%) and inter-modality and integrated logistics enhancement (2.5%). Differently, Spanish government emphasises its interest in sustainable mobility through two separate missions. In details, within mission ‘II. Infrastructuras y ecosistemas resilientes‘ the development of sustainable, safe and connected mobility is promoted. Nevertheless, present goal also emerges in the first mission ‘I. Agenda urbana y rural, lucha contra la despoblación y desarrollo de la agricultura‘ in which the will to connect rural areas to metropolitan centres through sustainable mobility policies emerges. Railways connections improvement, transport integration and digitalization, as well as collective transport vehicles’ transition to green technologies represent indeed main Spanish initiative targets. French NRRP initiative refers to sustainable mobility actions within the green transition pillar (i). As far as the mission entitled ‘Infrastructures et mobilités vertes‘ is concerned, four tasks are related to investments in: boosting railway connections, accelerating works on transport infrastructures, supporting demand for clean vehicles, and greening current national vehicle fleet.
As far as the green transition is concerned, each country agrees on the need to develop innovative technologies and alternatives to traditional fossil fuels. In addition to technological research funding – a common point between the three plans compared – the objective of decarbonization is pursued with different strategies. In Italy and Spain, for example, importance is given to the issue of self-consumption and renewable energy communities (referred to in RED II Directive), with a view to the progressive decentralization of the energy sector and aimed at suggesting virtuous consumption habits to the end user. On the other hand, French Plan intends the energy transition linked mainly to the conversion of the public, private and small and medium-sized real estate stock, thus encouraging the strengthening of transnational infrastructures and networks in order to improve the energy mix and ensure greater economic convenience for each user.
Despite different classification and allocation of respective strategies targeting specifical territorial goals, Italian, Spanish and French plans address similar actions and tools, thus supporting a wider integration of national infrastructural investments within EU framework and network.
Two lines of thought and action emerge indeed: on one hand widespread system investments may change infrastructural structure and network at a national level, while on the other hand, punctual investments acting directly at micro level, may interfere with and change the habits of citizens as well as local framework for administrations.
Despite micro-level actions may prove more directly involved in local transition, general network strategies could drive massive change in national transport system. Nevertheless, this second cluster of initiatives require to be supported and integrated at a EU level to ensure long- term and widespread effectiveness and outcomes. In this direction, coherence among individual NRRP targets may constitute a key-element, especially for bordering countries.
Conclusion, managerial implications and limitations
The great amount of resources allocated within NRRP framework requires to develop proper evaluation methodologies to assess derived outcomes and impacts. It is therefore required to provide standardized approach enabling scholars, policy-makers as well as simple citizens to compare and analyse strategical actions and results. Nevertheless, being an EU initiative implemented at national level, particular attention needs to be paid also to Member State own declination and implementation of policies and strategies, since context-related variables may interfere with actions design and outcomes. Proposed approach may represent a good starting point for the assessment of NRRPs and other EU-led development strategies regarding energy, mobility and transport sectors, both in the short and long run (such as TEN-E and TEN-T networks development). In details, present research addresses the need to frame national ways to face problem-setting as well as action design steps, thus targeting expected outcomes, not only to develop progressive evaluation tools in the implementation phase, but also to provide suitable framework for the ex-post monitoring of impacts and results. Similar qualitative approach may be integrated in the future through the definition of dedicated indicators enabling cross-national initiative comparison and assessment.
References
Afman, E., Engels, S., Langedijk, S., & Pfeiffer, P. (2021). An overview of the economics of the Recovery and Resilience Facility. Quarterly Report on the Euro Area (QREA), 20(3), 7-16.
Bisciari, P., Butzen, P., Gelade, W., Melyn, W., & Van Parys, S. (2021). The EU budget and the Next Generation EU Recovery Plan: a game changer. NBB Economic Review, (39).
Belicka, D., Krupenko, D., Hindriks, I., Rodrigues, M. & Fuchs, G. (2022), Research for TRAN Committee – The future of transport in the context of the Recovery Plan, European Parliament, Policy Department for Structural and Cohesion Policies, Brussels
Darvas, Z. (2020). Having the cake, but slicing it differently: how is the grand EU recovery fund allocated?. Bruegel-Blogs, NA-NA.
European Commission (2018). Directive (EU) 2018/2001 of the European Parliament and of theCouncil of 11 December 2018 on the promotion of the use of energy from renewable sources (recast). Available at: https://eur-lex.europa.eu/legal-content/EN/TXT/?uri=uriserv:OJ.L_.2018.328.01.0082.01.ENG&toc=OJ:L:2018:328:TOC (accessed 20 July 2023).
European Commission (2019). Smarter, greener, more inclusive? Indicators to support the Europe 2020 Strategy. Available at https://ec.europa.eu/eurostat/web/products-statistical-books/-/ks-04-19-559 (accessed 19 May 2023).
European Commission (2023). Recovery and Resilience Scoreboard. Available at : https://ec.europa.eu/economy_finance/recovery-and-resilience-scoreboard/index.html?lang=en (accessed 19 May 2023).
European Commission (2023). Common Inidcators. Available at: https://ec.europa.eu/economy_finance/recovery-and-resilience-scoreboard/common_indicators.html (accessed 20 July 2023)
European Environmental Agency (2019). Greenhouse gas emissions by aggregated sector. Available at: https://www.eea.europa.eu/data-and-maps/daviz/ghg-emissions-by-aggregated-sector-5/#tab-chart_3a(ccessed 19 May 2023).
French Government (2021). Plan National de Relance et de Résilience. Available at : https://minefi.hosting.augure.com/Augure_Minefi/r/ContenuEnLigne/Download?id=76326F03-443F-4B0E-9C33-BB5CA147E1F7&filename=PNRR%20-%20Synth%C3%A8se%20%28FR%29.pdf
Gaglione, F., & Ayiine-Etigo, D. A. (2021). Resilience as an urban strategy: a comparison of resources and interventions in the European Recovery Plans for the green transition. TeMA- Journal of Land Use, Mobility and Environment, 14(3), 501-506.
Gierten, D. and M. Lesher (2022), Assessing national digital strategies and their governance, OECD Digital Economy Papers, No. 324, OECD Publishing, Paris, https://doi.org/10.1787/baffceca-en.
Italian Government (2021). Piano Nazionale di Ripresa e Resilienza. Available at: https://www.governo.it/sites/governo.it/files/PNRR.pdf
Kivimaa, P., Lukkarinen, J., & Lazarevic, D. (2023). Analysis of COVID-19 recovery and resiliencepolicy in Finland: a transformative policy mix approach. Science and Public Policy, scad016.
Luo, C. M. (2022). The COVID-19 crisis: The EU recovery fund and its implications for European integration–a paradigm shift. European Review, 30(3), 374-392.
Nicodème, C. (2023). Mobility and Recovery in Europe: Impact of the Covid-19 Crisis A European Comparative Analysis. Transportation Research Procedia, 69, 902-909.
Pilati, M. (2021). National Recovery and Resilience Plans: Empowering the green and digital transitions? EPC Discussion Paper April 2021.
Posaner J. and Mischke J. (2020) Angela Merkel: coronavirus ‘biggest test’ yet for for EU. Politico 6 April 2020.
Quitzow, R., Bersalli, G., Lilliestam, J., & Prontera, A. (2022). Green Recovery: Catalyst for an Enhanced Role of the EU in Climate and Energy Policy?. In Handbook on European Union Climate Change Policy and Politics. Edward Elgar Publishing Ltd.
Spanish Government (2021). Plan de Recuperación, Transformación y Resiliencia. Available at: https://planderecuperacion.gob.es/
Tagliapietra, S. (2021). European Union countries’ National Recovery and Resilience Plans: A cross-country comparison. Testimony before the Economic Affairs Committee of the French Senate,Available at: https://www.bruegel.org/dataset/european-union-countries-recovery-and-resilience-plans
Haaga-Helia Publications 4/2024
ISSN 2342-2939
ISBN 978-952-7474-64-8